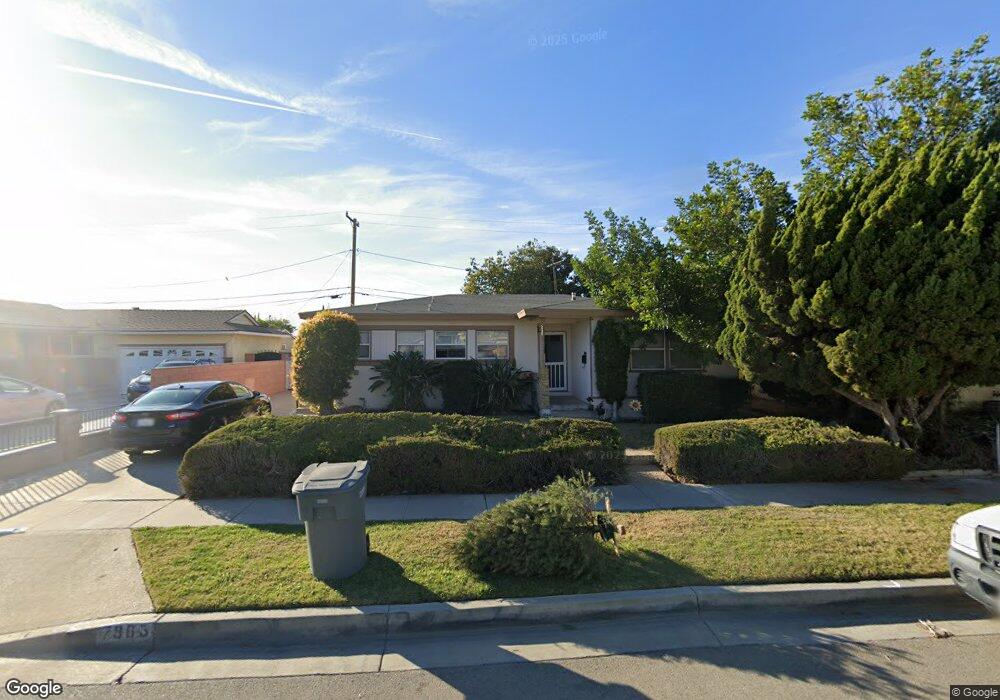
7865 San Rafael Dr Buena Park, CA 90620
Estimated Value: $854,000 - $918,000
3
Beds
2
Baths
1,195
Sq Ft
$738/Sq Ft
Est. Value
About This Home
This home is located at 7865 San Rafael Dr, Buena Park, CA 90620 and is currently estimated at $881,635, approximately $737 per square foot. 7865 San Rafael Dr is a home located in Orange County with nearby schools including Raymond Temple Elementary School, Walker Junior High School, and John F. Kennedy High School.
Ownership History
Date
Name
Owned For
Owner Type
Purchase Details
Closed on
Aug 3, 2016
Sold by
Two United Oil Llc
Bought by
Two United Oil Llc
Current Estimated Value
Purchase Details
Closed on
Nov 19, 2014
Sold by
Othman Allen
Bought by
Two United Oil Llc
Purchase Details
Closed on
Apr 9, 2007
Sold by
Qahoush Mohammed A and Othman Allen A
Bought by
Othman Allen A
Home Financials for this Owner
Home Financials are based on the most recent Mortgage that was taken out on this home.
Original Mortgage
$417,000
Interest Rate
6.13%
Mortgage Type
New Conventional
Purchase Details
Closed on
Feb 7, 2005
Sold by
Qahoush Dana
Bought by
Qahoush Mohamad A
Home Financials for this Owner
Home Financials are based on the most recent Mortgage that was taken out on this home.
Original Mortgage
$424,800
Interest Rate
5.62%
Mortgage Type
Purchase Money Mortgage
Create a Home Valuation Report for This Property
The Home Valuation Report is an in-depth analysis detailing your home's value as well as a comparison with similar homes in the area
Home Values in the Area
Average Home Value in this Area
Purchase History
| Date | Buyer | Sale Price | Title Company |
|---|---|---|---|
| Two United Oil Llc | -- | Old Republic Title Company | |
| Two United Oil Llc | -- | Accommodation | |
| Othman Allen A | -- | Alliance Title Company | |
| Qahoush Mohamad A | -- | -- | |
| Qahoush Mohammed A | $472,000 | -- |
Source: Public Records
Mortgage History
| Date | Status | Borrower | Loan Amount |
|---|---|---|---|
| Previous Owner | Othman Allen A | $417,000 | |
| Previous Owner | Qahoush Mohammed A | $424,800 |
Source: Public Records
Tax History Compared to Growth
Tax History
| Year | Tax Paid | Tax Assessment Tax Assessment Total Assessment is a certain percentage of the fair market value that is determined by local assessors to be the total taxable value of land and additions on the property. | Land | Improvement |
|---|---|---|---|---|
| 2025 | $6,587 | $570,873 | $508,230 | $62,643 |
| 2024 | $6,587 | $559,680 | $498,265 | $61,415 |
| 2023 | $6,425 | $548,706 | $488,495 | $60,211 |
| 2022 | $6,347 | $537,948 | $478,917 | $59,031 |
| 2021 | $6,257 | $527,400 | $469,526 | $57,874 |
| 2020 | $6,222 | $521,993 | $464,712 | $57,281 |
| 2019 | $6,065 | $511,758 | $455,600 | $56,158 |
| 2018 | $5,955 | $501,724 | $446,667 | $55,057 |
| 2017 | $5,767 | $491,887 | $437,909 | $53,978 |
| 2016 | $5,658 | $482,243 | $429,323 | $52,920 |
| 2015 | $5,596 | $475,000 | $422,874 | $52,126 |
| 2014 | $4,617 | $400,510 | $338,930 | $61,580 |
Source: Public Records
Map
Nearby Homes
- 7571 San Rafael Dr
- 6191 San Ramon Way
- 5837 Los Arcos Way
- 7837 La Costa Cir
- 5836 Trinidad Way
- 8456 San Clemente Way
- 6601 Naomi Ave
- 5686 Panama Dr
- 8072 San Hilario Cir
- 6932 San Joaquin Cir
- 5568 Ozawa Cir
- 6961 San Julian Cir
- 8623 Valley View St
- 6996 Naomi Ave
- 7531 Knott Ave
- 5921 Los Ramos Cir
- 6932 San Diego Dr
- 5412 Bransford Dr
- 5612 Sprague Ave
- 6861 Frost Cir
- 7877 San Rafael Dr
- 7853 San Rafael Dr
- 7878 La Casa Way
- 7866 La Casa Way
- 7841 San Rafael Dr
- 7889 San Rafael Dr
- 7890 La Casa Way
- 7854 La Casa Way
- 7866 San Rafael Dr
- 7878 San Rafael Dr
- 7829 San Rafael Dr
- 7902 La Casa Way
- 7854 San Rafael Dr
- 7890 San Rafael Dr
- 7842 San Rafael Dr
- 7830 La Casa Way
- 7817 San Rafael Dr
- 7865 La Casa Way
- 7877 La Casa Way
- 7917 San Rafael Dr