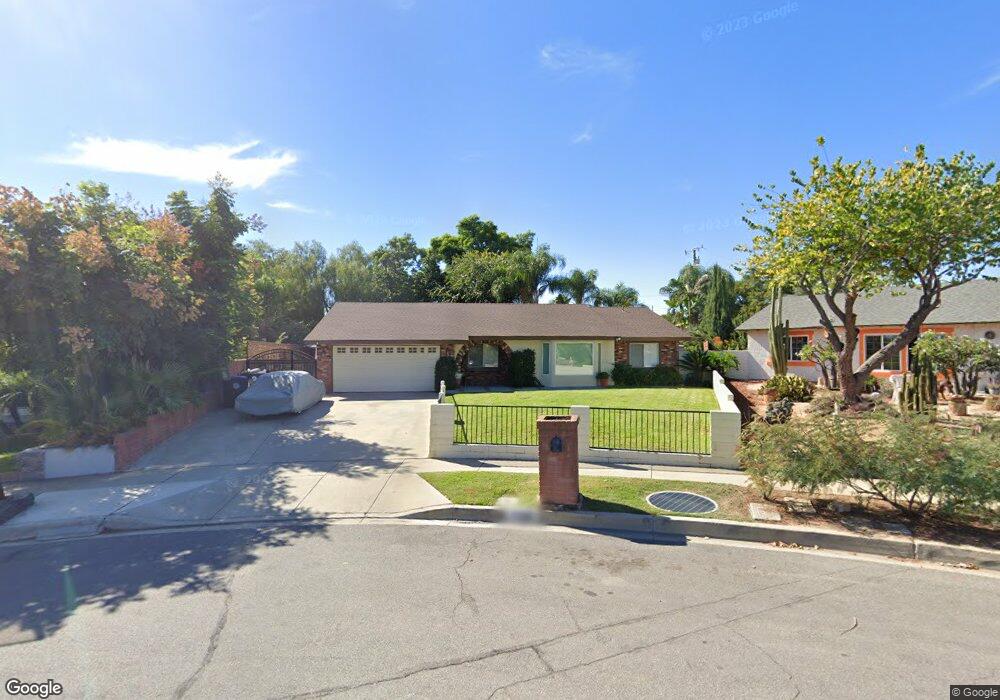
7866 Hickory Cir Rancho Cucamonga, CA 91730
Estimated Value: $736,000 - $765,000
3
Beds
2
Baths
1,584
Sq Ft
$472/Sq Ft
Est. Value
About This Home
This home is located at 7866 Hickory Cir, Rancho Cucamonga, CA 91730 and is currently estimated at $747,341, approximately $471 per square foot. 7866 Hickory Cir is a home located in San Bernardino County with nearby schools including Valle Vista Elementary, Cucamonga Middle, and Alta Loma High.
Ownership History
Date
Name
Owned For
Owner Type
Purchase Details
Closed on
Mar 25, 2013
Sold by
Hagemann Gary
Bought by
Maccharles Jamie and Maccharles Christopher
Current Estimated Value
Purchase Details
Closed on
May 17, 2007
Sold by
Hagemann Gary
Bought by
Hagemann Gary and G Hagemann Revocable Trust
Purchase Details
Closed on
Oct 29, 2004
Sold by
Heredia Moses T
Bought by
Hagemann Gary
Purchase Details
Closed on
Nov 27, 1996
Sold by
Heredia Moses T
Bought by
Heredia Moses T
Home Financials for this Owner
Home Financials are based on the most recent Mortgage that was taken out on this home.
Original Mortgage
$111,000
Interest Rate
7.76%
Purchase Details
Closed on
Oct 9, 1996
Sold by
Bustamante Ralph
Bought by
Heredia Moses T
Home Financials for this Owner
Home Financials are based on the most recent Mortgage that was taken out on this home.
Original Mortgage
$111,000
Interest Rate
7.76%
Purchase Details
Closed on
May 17, 1996
Sold by
Bustamante Ralph
Bought by
Bustamante Ralph and Heredia Moses
Create a Home Valuation Report for This Property
The Home Valuation Report is an in-depth analysis detailing your home's value as well as a comparison with similar homes in the area
Home Values in the Area
Average Home Value in this Area
Purchase History
| Date | Buyer | Sale Price | Title Company |
|---|---|---|---|
| Maccharles Jamie | -- | None Available | |
| Hagemann Gary | -- | None Available | |
| Hagemann Gary | $389,000 | Orange Coast Title Company | |
| Heredia Moses T | -- | United Independent Title Ins | |
| Heredia Moses T | -- | United Independence Title In | |
| Bustamante Ralph | -- | -- |
Source: Public Records
Mortgage History
| Date | Status | Borrower | Loan Amount |
|---|---|---|---|
| Previous Owner | Heredia Moses T | $111,000 |
Source: Public Records
Tax History Compared to Growth
Tax History
| Year | Tax Paid | Tax Assessment Tax Assessment Total Assessment is a certain percentage of the fair market value that is determined by local assessors to be the total taxable value of land and additions on the property. | Land | Improvement |
|---|---|---|---|---|
| 2025 | $4,488 | $412,530 | $141,614 | $270,916 |
| 2024 | $4,488 | $404,441 | $138,837 | $265,604 |
| 2023 | $4,391 | $396,511 | $136,115 | $260,396 |
| 2022 | $4,321 | $388,736 | $133,446 | $255,290 |
| 2021 | $4,320 | $381,113 | $130,829 | $250,284 |
| 2020 | $4,197 | $377,206 | $129,488 | $247,718 |
| 2019 | $4,178 | $369,810 | $126,949 | $242,861 |
| 2018 | $4,061 | $362,559 | $124,460 | $238,099 |
| 2017 | $3,988 | $355,450 | $122,020 | $233,430 |
| 2016 | $3,941 | $348,480 | $119,627 | $228,853 |
| 2015 | $3,899 | $343,245 | $117,830 | $225,415 |
| 2014 | $3,786 | $336,521 | $115,522 | $220,999 |
Source: Public Records
Map
Nearby Homes
- 7719 Vineyard Ave
- 0 Camino Predera Unit OC25188933
- 0 Camino Predera Unit WS25184133
- 8091 Camino Predera
- 8976 Yew St
- 8167 Vineyard Ave Unit 23
- 8167 Vineyard Ave Unit 38
- 8167 Vineyard Ave Unit 109
- 7906 Montara Ave
- 8651 Foothill Blvd Unit 63
- 8651 Foothill Blvd Unit 18
- 8651 Foothill Blvd Unit 46
- 8651 Foothill Blvd Unit 99
- 8651 Foothill Blvd Unit 42
- 8525 Calle Carabe St Unit 45
- 8305 Highridge Place
- 9340 Foothill Blvd Unit 68
- 9340 Foothill Blvd Unit 61
- 9340 Foothill Blvd
- 8814 Knollwood Place
- 7860 Hickory Cir
- 7874 Hickory Cir
- 7854 Hickory Cir
- 7888 Hickory Cir
- 7891 Vineyard Ave
- 7879 Hickory Cir
- 8920 Reeves Ct
- 8930 Reeves Ct
- 7845 Hickory Cir
- 8886 Hemlock St
- 8906 Hemlock St
- 7838 Hickory Cir
- 8940 Reeves Ct
- 8916 Hemlock St
- 7797 Vineyard Ave
- 8921 Reeves Ct
- 7835 Hickory Cir
- 7850 Vineyard Ave
- 7860 Vineyard Ave
- 7870 Vineyard Ave