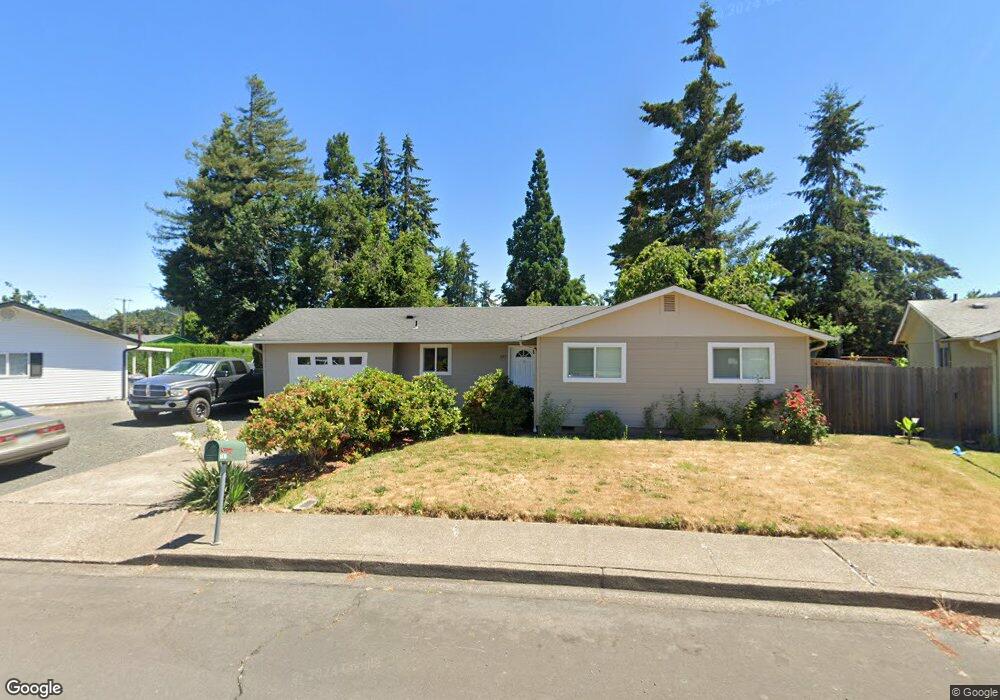
787 70th St Springfield, OR 97478
Thurston NeighborhoodEstimated Value: $350,377 - $396,000
3
Beds
1
Bath
1,049
Sq Ft
$358/Sq Ft
Est. Value
About This Home
This home is located at 787 70th St, Springfield, OR 97478 and is currently estimated at $375,094, approximately $357 per square foot. 787 70th St is a home located in Lane County with nearby schools including Thurston Elementary School, Thurston Middle School, and Thurston High School.
Ownership History
Date
Name
Owned For
Owner Type
Purchase Details
Closed on
Jun 29, 2016
Sold by
Michael P Miller Combination Prototype P
Bought by
Miner Chase Cole
Current Estimated Value
Home Financials for this Owner
Home Financials are based on the most recent Mortgage that was taken out on this home.
Original Mortgage
$179,100
Outstanding Balance
$142,203
Interest Rate
3.58%
Mortgage Type
New Conventional
Estimated Equity
$232,891
Purchase Details
Closed on
Mar 2, 2016
Sold by
Witkin Adam
Bought by
Michael P Miller Combination Prototype P
Purchase Details
Closed on
Oct 26, 1998
Sold by
Gene Martin Lanny
Bought by
Martin Lanny Gene and Martin Debra
Home Financials for this Owner
Home Financials are based on the most recent Mortgage that was taken out on this home.
Original Mortgage
$77,000
Interest Rate
6.6%
Create a Home Valuation Report for This Property
The Home Valuation Report is an in-depth analysis detailing your home's value as well as a comparison with similar homes in the area
Home Values in the Area
Average Home Value in this Area
Purchase History
| Date | Buyer | Sale Price | Title Company |
|---|---|---|---|
| Miner Chase Cole | $199,000 | Fidelity Natl Title Co Of Or | |
| Michael P Miller Combination Prototype P | $140,000 | Fidelity Natl Title Co Of Or | |
| Martin Lanny Gene | -- | Key Title Company |
Source: Public Records
Mortgage History
| Date | Status | Borrower | Loan Amount |
|---|---|---|---|
| Open | Miner Chase Cole | $179,100 | |
| Previous Owner | Martin Lanny Gene | $77,000 |
Source: Public Records
Tax History
| Year | Tax Paid | Tax Assessment Tax Assessment Total Assessment is a certain percentage of the fair market value that is determined by local assessors to be the total taxable value of land and additions on the property. | Land | Improvement |
|---|---|---|---|---|
| 2025 | $2,884 | $157,270 | -- | -- |
| 2024 | $2,837 | $152,690 | -- | -- |
| 2023 | $2,837 | $148,243 | $0 | $0 |
| 2022 | $2,628 | $143,926 | $0 | $0 |
| 2021 | $2,581 | $139,734 | $0 | $0 |
| 2020 | $2,505 | $135,665 | $0 | $0 |
| 2019 | $2,430 | $131,714 | $0 | $0 |
| 2018 | $2,291 | $124,153 | $0 | $0 |
| 2017 | $2,203 | $124,153 | $0 | $0 |
| 2016 | $2,156 | $120,537 | $0 | $0 |
| 2015 | $2,095 | $117,026 | $0 | $0 |
| 2014 | $2,063 | $113,617 | $0 | $0 |
Source: Public Records
Map
Nearby Homes
- 7080 Thurston Rd Unit 2
- 6898 Thurston Rd
- 0 71st St
- 0 Omlid Dr Unit 1 706471345
- 0 Omlid Dr Unit 11
- 0 Omlid Dr Unit 27 796722689
- 0 Omlid Dr Unit 26 256458253
- 0 Omlid Dr Unit 10
- 0 Omlid Dr Unit 3 154724851
- 0 Omlid Dr Unit 2 312357104
- 353 71st St
- 6875 B St
- 555 66th St
- 250 68th St
- 246 S 70th St
- 6540 B St
- 6964 Bluebelle Way
- 6445 B St
- 616 S 71st St
- 7027 S E St
Your Personal Tour Guide
Ask me questions while you tour the home.