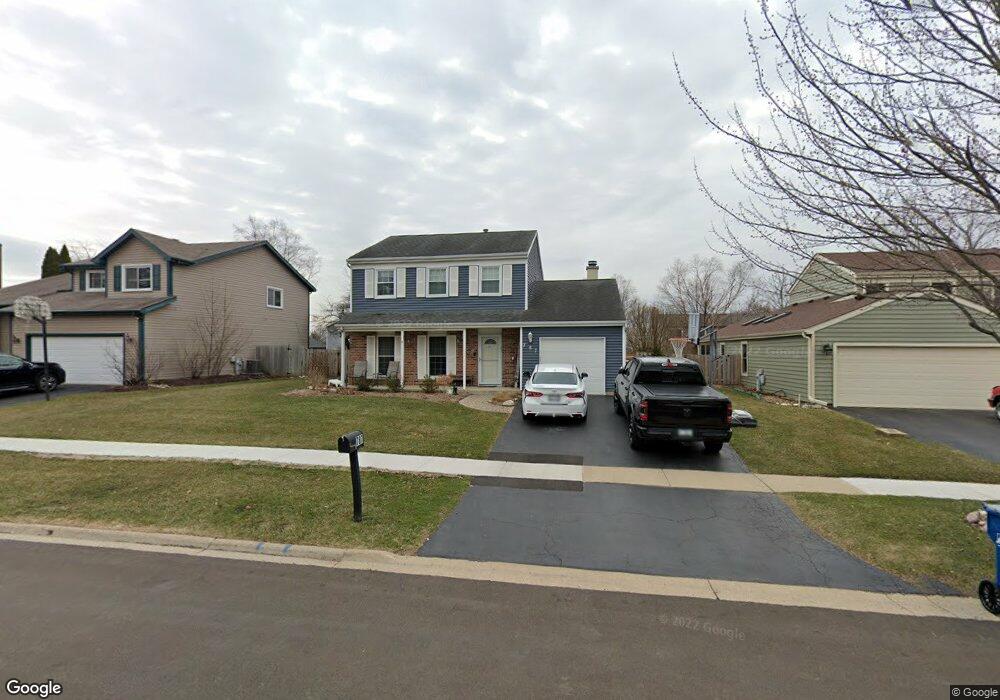
787 Orchid Ln Unit 6 Bartlett, IL 60103
South Tri Village NeighborhoodEstimated Value: $396,116 - $426,000
3
Beds
2
Baths
1,570
Sq Ft
$259/Sq Ft
Est. Value
About This Home
This home is located at 787 Orchid Ln Unit 6, Bartlett, IL 60103 and is currently estimated at $406,779, approximately $259 per square foot. 787 Orchid Ln Unit 6 is a home located in DuPage County with nearby schools including Sycamore Trails Elementary School, Eastview Middle School, and Bartlett High School.
Ownership History
Date
Name
Owned For
Owner Type
Purchase Details
Closed on
May 25, 2004
Sold by
Lynch James and Lynch Kathleen
Bought by
Collins Herbert L and Collins Nazira A
Current Estimated Value
Home Financials for this Owner
Home Financials are based on the most recent Mortgage that was taken out on this home.
Original Mortgage
$234,815
Outstanding Balance
$113,261
Interest Rate
5.91%
Mortgage Type
FHA
Estimated Equity
$293,518
Purchase Details
Closed on
Aug 24, 1995
Sold by
Nutley Patrick A and Nutley Martha I
Bought by
Lnch James and Lynch Kathleen
Home Financials for this Owner
Home Financials are based on the most recent Mortgage that was taken out on this home.
Original Mortgage
$140,760
Interest Rate
7.55%
Mortgage Type
Assumption
Create a Home Valuation Report for This Property
The Home Valuation Report is an in-depth analysis detailing your home's value as well as a comparison with similar homes in the area
Home Values in the Area
Average Home Value in this Area
Purchase History
| Date | Buyer | Sale Price | Title Company |
|---|---|---|---|
| Collins Herbert L | -- | Preferred Title Ins Agency | |
| Lnch James | $142,000 | -- |
Source: Public Records
Mortgage History
| Date | Status | Borrower | Loan Amount |
|---|---|---|---|
| Open | Collins Herbert L | $234,815 | |
| Previous Owner | Lnch James | $140,760 |
Source: Public Records
Tax History Compared to Growth
Tax History
| Year | Tax Paid | Tax Assessment Tax Assessment Total Assessment is a certain percentage of the fair market value that is determined by local assessors to be the total taxable value of land and additions on the property. | Land | Improvement |
|---|---|---|---|---|
| 2024 | $7,964 | $106,494 | $35,237 | $71,257 |
| 2023 | $7,304 | $96,620 | $31,970 | $64,650 |
| 2022 | $7,144 | $87,760 | $29,710 | $58,050 |
| 2021 | $6,934 | $83,310 | $28,200 | $55,110 |
| 2020 | $6,763 | $80,810 | $27,350 | $53,460 |
| 2019 | $6,667 | $77,920 | $26,370 | $51,550 |
| 2018 | $6,556 | $74,560 | $25,230 | $49,330 |
| 2017 | $6,363 | $71,580 | $24,220 | $47,360 |
| 2016 | $6,233 | $68,370 | $23,130 | $45,240 |
| 2015 | $6,211 | $64,710 | $21,890 | $42,820 |
| 2014 | $5,571 | $61,070 | $21,330 | $39,740 |
| 2013 | $6,690 | $62,530 | $21,840 | $40,690 |
Source: Public Records
Map
Nearby Homes
- 1208 Dogwood Ln
- 1038 Martingale Dr
- 1201 Pinetree Ln
- 1024 Confederation Dr
- 701 W Stearns Rd
- 978 Sycamore Ln
- 577 Eastwick Ln
- 1027 Georgian Place
- 5N444 S Bartlett Rd
- 1151 Struckman Blvd
- 1053 Hummingbird Way
- 152 Orchards Pass Unit 32E
- 1074 - 1078 Sante Fe Stre St
- 7N350 Route 59 Hwy
- 1411 Steeplechase Rd
- 1307 Saddlebrook Rd
- 1271 Appaloosa Way
- 30W030 Schick Rd
- 1433 Quincy Bridge Ct Unit 37
- 1384 Northgate Dr