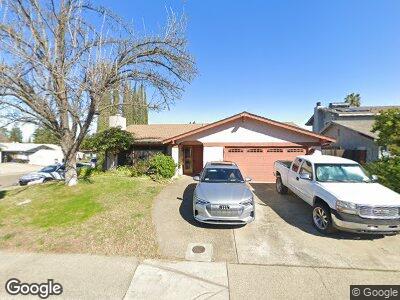
7871 McLin Way Citrus Heights, CA 95610
Sylvan Old Auburn Road NeighborhoodEstimated Value: $530,000 - $538,000
4
Beds
2
Baths
1,936
Sq Ft
$276/Sq Ft
Est. Value
About This Home
This home is located at 7871 McLin Way, Citrus Heights, CA 95610 and is currently estimated at $533,650, approximately $275 per square foot. 7871 McLin Way is a home located in Sacramento County with nearby schools including Mariposa Avenue Elementary School, Sylvan Middle School, and San Juan High School.
Ownership History
Date
Name
Owned For
Owner Type
Purchase Details
Closed on
Sep 12, 2019
Sold by
Barton David
Bought by
Barton David W and Jackson Anne E
Current Estimated Value
Purchase Details
Closed on
Jul 1, 2019
Sold by
Jackson Anne E
Bought by
Jackson Anne E and Barton David W
Purchase Details
Closed on
Jan 26, 2013
Sold by
Jackson Anne E
Bought by
Jackson Anne E and Barton David
Home Financials for this Owner
Home Financials are based on the most recent Mortgage that was taken out on this home.
Original Mortgage
$160,000
Outstanding Balance
$115,748
Interest Rate
3.34%
Mortgage Type
New Conventional
Estimated Equity
$404,613
Purchase Details
Closed on
May 19, 1999
Sold by
Zicarelli Dale G and Lee Ann
Bought by
Jackson Anne E
Home Financials for this Owner
Home Financials are based on the most recent Mortgage that was taken out on this home.
Original Mortgage
$139,650
Interest Rate
6.86%
Create a Home Valuation Report for This Property
The Home Valuation Report is an in-depth analysis detailing your home's value as well as a comparison with similar homes in the area
Home Values in the Area
Average Home Value in this Area
Purchase History
| Date | Buyer | Sale Price | Title Company |
|---|---|---|---|
| Barton David W | -- | None Available | |
| Jackson Anne E | -- | None Available | |
| Jackson Anne E | -- | Lsi | |
| Jackson Anne E | $147,000 | Financial Title Company |
Source: Public Records
Mortgage History
| Date | Status | Borrower | Loan Amount |
|---|---|---|---|
| Open | Jackson Anne E | $160,000 | |
| Closed | Jackson Anne E | $170,000 | |
| Closed | Zicarelli Dale G | $180,000 | |
| Closed | Jackson Anne E | $139,650 | |
| Previous Owner | Zicarelli Dale G | $80,000 |
Source: Public Records
Tax History Compared to Growth
Tax History
| Year | Tax Paid | Tax Assessment Tax Assessment Total Assessment is a certain percentage of the fair market value that is determined by local assessors to be the total taxable value of land and additions on the property. | Land | Improvement |
|---|---|---|---|---|
| 2024 | $2,655 | $225,911 | $53,782 | $172,129 |
| 2023 | $2,586 | $221,482 | $52,728 | $168,754 |
| 2022 | $2,571 | $217,141 | $51,695 | $165,446 |
| 2021 | $2,527 | $212,884 | $50,682 | $162,202 |
| 2020 | $2,480 | $210,702 | $50,163 | $160,539 |
| 2019 | $2,429 | $206,572 | $49,180 | $157,392 |
| 2018 | $2,399 | $202,522 | $48,216 | $154,306 |
| 2017 | $2,374 | $198,552 | $47,271 | $151,281 |
| 2016 | $2,217 | $194,660 | $46,345 | $148,315 |
| 2015 | $2,179 | $191,737 | $45,649 | $146,088 |
| 2014 | $2,132 | $187,982 | $44,755 | $143,227 |
Source: Public Records
Map
Nearby Homes
- 7037 Lynnetree Way
- 7069 Lynnetree Way
- 7864 Sunrise Terrace Ln
- 7131 Maretha St
- 7177 Canelo Hills Dr
- 7421 Sunrise Blvd
- 7153 Canelo Hills Dr
- 6935 W Oak Ct
- 7223 Oconee Ct
- 7080 Canelo Hills Dr
- 6928 Trovita Way
- 8044 Hoopes Dr
- 7526 Buckhaven Way
- 6903 Maddie Mae Ln
- 7401 Mariposa Ave
- 13637 Fair Oaks Blvd
- 7668 Cook Ave
- 7731 Spring Valley Ave
- 8059 Camstock Ct
- 6704 Green Ash Ct
- 7871 McLin Way
- 7875 McLin Way
- 7206 Geowood Way
- 7128 Geowood Way
- 7879 McLin Way
- 7205 Geowood Way
- 7133 Geowood Way
- 7876 Pilkerton Ct
- 7210 Geowood Way
- 7209 Geowood Way
- 7129 Geowood Way
- 7874 McLin Way
- 7124 Geowood Way
- 7883 McLin Way
- 7880 Pilkerton Ct
- 7878 McLin Way
- 7213 Geowood Way
- 7125 Geowood Way
- 7840 Casa Bella Way
- 7844 Casa Bella Way