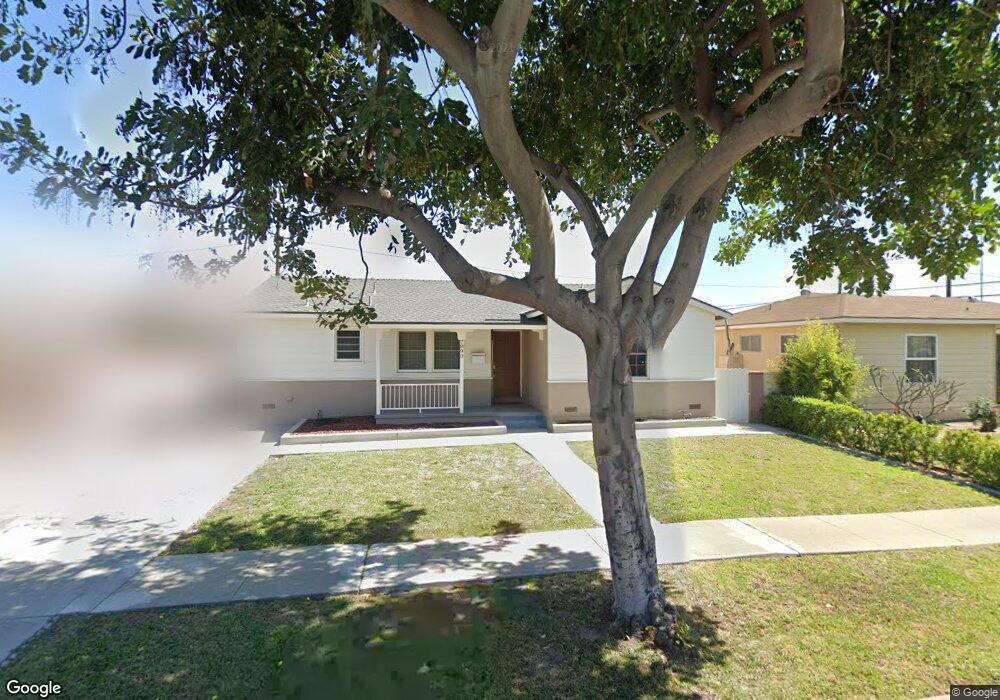
7890 La Carta Cir Buena Park, CA 90620
Estimated Value: $813,472 - $900,000
3
Beds
2
Baths
1,195
Sq Ft
$712/Sq Ft
Est. Value
About This Home
This home is located at 7890 La Carta Cir, Buena Park, CA 90620 and is currently estimated at $850,368, approximately $711 per square foot. 7890 La Carta Cir is a home located in Orange County with nearby schools including Raymond Temple Elementary School, Walker Junior High School, and John F. Kennedy High School.
Ownership History
Date
Name
Owned For
Owner Type
Purchase Details
Closed on
Jul 27, 2011
Sold by
Deutsche Bank National Trust Company
Bought by
Cho Christopher L and Cho Wendy Yu
Current Estimated Value
Purchase Details
Closed on
Apr 20, 2011
Sold by
Ayoub Tony Haliem
Bought by
Deutsche Bank National Trust Company
Purchase Details
Closed on
Apr 22, 1997
Sold by
Gerges Mary
Bought by
Ayoub Tony Haliem
Home Financials for this Owner
Home Financials are based on the most recent Mortgage that was taken out on this home.
Original Mortgage
$122,400
Interest Rate
7.86%
Purchase Details
Closed on
Nov 14, 1996
Sold by
Gmac Mtg Corp
Bought by
Federal Home Loan Mortgage Corporation
Create a Home Valuation Report for This Property
The Home Valuation Report is an in-depth analysis detailing your home's value as well as a comparison with similar homes in the area
Home Values in the Area
Average Home Value in this Area
Purchase History
| Date | Buyer | Sale Price | Title Company |
|---|---|---|---|
| Cho Christopher L | $283,000 | Lsi Title Company | |
| Deutsche Bank National Trust Company | $287,103 | Accommodation | |
| Ayoub Tony Haliem | -- | Chicago Title Co | |
| Ayoub Tony Haliem | $153,000 | -- | |
| Federal Home Loan Mortgage Corporation | -- | First American Title Ins Co | |
| Gmac Mtg Corp | $137,000 | First American Title Ins Co |
Source: Public Records
Mortgage History
| Date | Status | Borrower | Loan Amount |
|---|---|---|---|
| Previous Owner | Ayoub Tony Haliem | $122,400 |
Source: Public Records
Tax History Compared to Growth
Tax History
| Year | Tax Paid | Tax Assessment Tax Assessment Total Assessment is a certain percentage of the fair market value that is determined by local assessors to be the total taxable value of land and additions on the property. | Land | Improvement |
|---|---|---|---|---|
| 2025 | $4,249 | $355,459 | $293,457 | $62,002 |
| 2024 | $4,249 | $348,490 | $287,703 | $60,787 |
| 2023 | $4,144 | $341,657 | $282,061 | $59,596 |
| 2022 | $4,091 | $334,958 | $276,530 | $58,428 |
| 2021 | $4,033 | $328,391 | $271,108 | $57,283 |
| 2020 | $4,009 | $325,024 | $268,328 | $56,696 |
| 2019 | $3,912 | $318,651 | $263,066 | $55,585 |
| 2018 | $3,842 | $312,403 | $257,907 | $54,496 |
| 2017 | $3,723 | $306,278 | $252,850 | $53,428 |
| 2016 | $3,653 | $300,273 | $247,892 | $52,381 |
| 2015 | $3,613 | $295,763 | $244,168 | $51,595 |
| 2014 | $3,434 | $289,970 | $239,385 | $50,585 |
Source: Public Records
Map
Nearby Homes
- 6191 San Ramon Way
- 5837 Los Arcos Way
- 7571 San Rafael Dr
- 8456 San Clemente Way
- 7837 La Costa Cir
- 5836 Trinidad Way
- 5686 Panama Dr
- 6601 Naomi Ave
- 8072 San Hilario Cir
- 8623 Valley View St
- 5568 Ozawa Cir
- 6932 San Joaquin Cir
- 6961 San Julian Cir
- 5921 Los Ramos Cir
- 5342 La Luna Dr
- 6932 San Diego Dr
- 6996 Naomi Ave
- 7531 Knott Ave
- 5612 Sprague Ave
- 8757 Los Altos Dr
- 7878 La Carta Cir
- 7902 La Carta Cir
- 7889 La Casa Way
- 7877 La Casa Way
- 7901 La Casa Way
- 7866 La Carta Cir
- 7889 La Carta Cir
- 7877 La Carta Cir
- 7865 La Casa Way
- 7901 La Carta Cir
- 7865 La Carta Cir
- 7854 La Carta Cir
- 7926 La Carta Cir
- 7853 La Casa Way
- 7925 La Casa Way
- 7913 La Carta Cir
- 7853 La Carta Cir
- 7842 La Carta Cir
- 7938 La Carta Cir
- 7890 La Casa Way