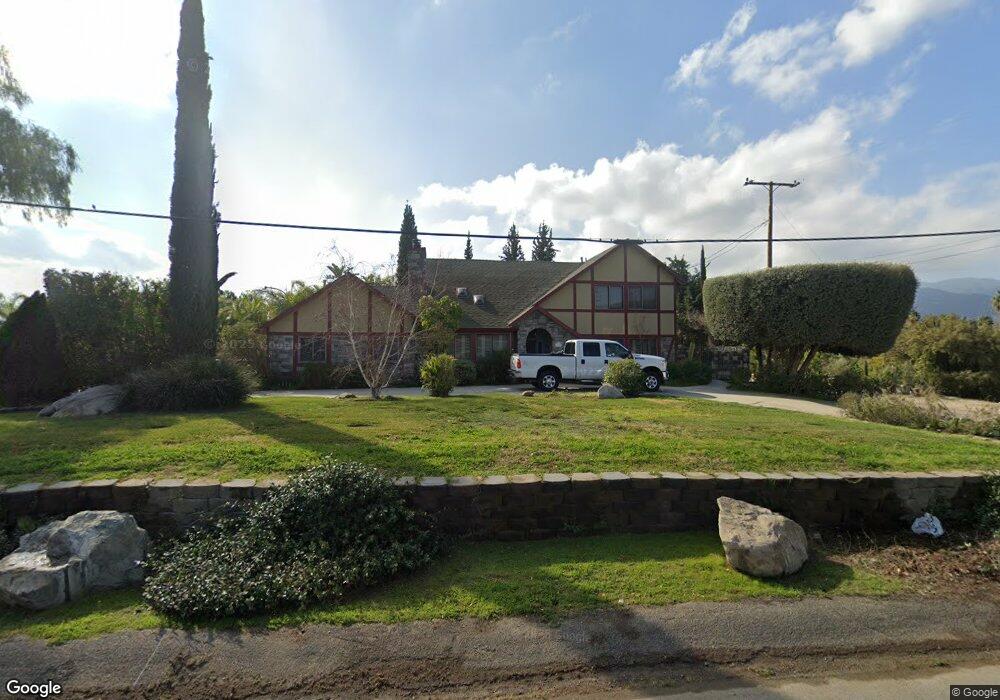
7895 Hillside St Corona, CA 92881
El Cerrito NeighborhoodEstimated Value: $701,000 - $867,000
4
Beds
3
Baths
1,837
Sq Ft
$438/Sq Ft
Est. Value
About This Home
This home is located at 7895 Hillside St, Corona, CA 92881 and is currently estimated at $804,263, approximately $437 per square foot. 7895 Hillside St is a home located in Riverside County with nearby schools including Woodrow Wilson Elementary School, El Cerrito Middle School, and Centennial High School.
Ownership History
Date
Name
Owned For
Owner Type
Purchase Details
Closed on
Apr 1, 2003
Sold by
Leduc Lisa M
Bought by
Leduc John C
Current Estimated Value
Home Financials for this Owner
Home Financials are based on the most recent Mortgage that was taken out on this home.
Original Mortgage
$280,000
Outstanding Balance
$132,305
Interest Rate
7.25%
Estimated Equity
$671,958
Purchase Details
Closed on
Feb 28, 2003
Sold by
Leduc John C
Bought by
Walker Edward George
Home Financials for this Owner
Home Financials are based on the most recent Mortgage that was taken out on this home.
Original Mortgage
$280,000
Outstanding Balance
$132,305
Interest Rate
7.25%
Estimated Equity
$671,958
Purchase Details
Closed on
Aug 17, 1998
Sold by
Leduc Family Trust
Bought by
Leduc John C
Home Financials for this Owner
Home Financials are based on the most recent Mortgage that was taken out on this home.
Original Mortgage
$40,240
Interest Rate
6.88%
Purchase Details
Closed on
Jan 26, 1994
Sold by
Leduc Leo M and Leduc Pauline
Bought by
Leduc Leo M and Leduc Pauline
Create a Home Valuation Report for This Property
The Home Valuation Report is an in-depth analysis detailing your home's value as well as a comparison with similar homes in the area
Home Values in the Area
Average Home Value in this Area
Purchase History
| Date | Buyer | Sale Price | Title Company |
|---|---|---|---|
| Leduc John C | -- | First American Title Co | |
| Walker Edward George | $280,000 | First American Title Co | |
| Leduc John C | -- | First American Title Ins Co | |
| Leduc Leo M | -- | -- |
Source: Public Records
Mortgage History
| Date | Status | Borrower | Loan Amount |
|---|---|---|---|
| Open | Walker Edward George | $280,000 | |
| Previous Owner | Leduc John C | $40,240 |
Source: Public Records
Tax History Compared to Growth
Tax History
| Year | Tax Paid | Tax Assessment Tax Assessment Total Assessment is a certain percentage of the fair market value that is determined by local assessors to be the total taxable value of land and additions on the property. | Land | Improvement |
|---|---|---|---|---|
| 2025 | $5,208 | $476,512 | $144,818 | $331,694 |
| 2023 | $5,208 | $458,011 | $139,196 | $318,815 |
| 2022 | $5,043 | $449,031 | $136,467 | $312,564 |
| 2021 | $4,943 | $440,228 | $133,792 | $306,436 |
| 2020 | $4,888 | $435,715 | $132,421 | $303,294 |
| 2019 | $4,775 | $427,173 | $129,825 | $297,348 |
| 2018 | $4,667 | $418,798 | $127,280 | $291,518 |
| 2017 | $4,552 | $410,587 | $124,785 | $285,802 |
| 2016 | $4,509 | $402,538 | $122,339 | $280,199 |
| 2015 | $4,410 | $396,493 | $120,502 | $275,991 |
| 2014 | $4,246 | $388,729 | $118,143 | $270,586 |
Source: Public Records
Map
Nearby Homes
- 19217 Ferrer Ave
- 0 Envoy Ave Unit ND25140700
- 19151 Diplomat Ave
- 7979 Minnesota Rd Unit A
- 19530 Arcadia St
- 19059 Diplomat Ave
- 19660 Arcadia St
- 19729 Arcadia St
- 8035 Santa Rita St
- 7245 Marilyn Dr
- 7237 Piute Creek Dr
- 7230 Sarsaparilla Dr
- 2825 Villa Catalonia Ct
- 7401 Liberty Ave
- 20171 Corona St
- 2955 Villa Catalonia Ct
- 2440 Marigold Way
- 20160 Kayne St
- 20280 Newton St
- 7160 Bel Air St
- 19236 Quebec Ave
- 0 Quebec Ave Unit IG12126986
- 0 Quebec Ave Unit IG12126974
- 0 Quebec Ave Unit IG12126964
- 0 Quebec Ave Unit IG12126954
- 0 Quebec Ave Unit IG14086779
- 0 Quebec Ave Unit IV15003475
- 0 Quebec Ave Unit CV24036595
- 0 Quebec Ave Unit OC22233402
- 0 Quebec Ave Unit PW22005121
- 0 Quebec Ave Unit PW22005116
- 0 Quebec Ave Unit PW22005113
- 0 Quebec Ave Unit PW22005079
- 0 Quebec Ave Unit PW21130841
- 0 Quebec Ave Unit PW21130832
- 0 Quebec Ave Unit PW21130806
- 0 Quebec Ave Unit PW21130794
- 19320 Quebec Ave
- 19224 Quebec Ave
- 19237 Stroh Ave