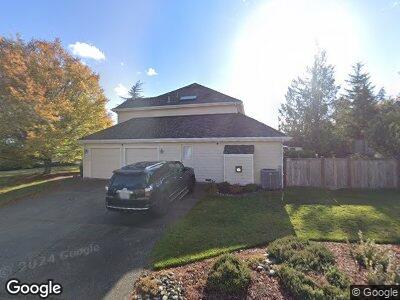
7896 Amethyst Loop NW Silverdale, WA 98383
Chico NeighborhoodEstimated Value: $601,770 - $710,000
4
Beds
3
Baths
2,367
Sq Ft
$282/Sq Ft
Est. Value
About This Home
This home is located at 7896 Amethyst Loop NW, Silverdale, WA 98383 and is currently estimated at $666,943, approximately $281 per square foot. 7896 Amethyst Loop NW is a home located in Kitsap County with nearby schools including Silverdale Elementary School, Central Kitsap Middle School, and Central Kitsap High School.
Ownership History
Date
Name
Owned For
Owner Type
Purchase Details
Closed on
Sep 27, 2023
Sold by
Corbell Randall D and Corbell Debra M
Bought by
Randall And Debra Corbell Living Trust and Corbell
Current Estimated Value
Purchase Details
Closed on
Jul 21, 2000
Sold by
Berry G A and Berry Janet K
Bought by
Corbell Randall D and Corbell Debra M
Home Financials for this Owner
Home Financials are based on the most recent Mortgage that was taken out on this home.
Original Mortgage
$202,987
Interest Rate
8.2%
Mortgage Type
VA
Purchase Details
Closed on
Jul 22, 1998
Sold by
Rogstad Allen R and Rogstad Shirley A
Bought by
Berry G A and Berry Janet K
Home Financials for this Owner
Home Financials are based on the most recent Mortgage that was taken out on this home.
Original Mortgage
$70,000
Interest Rate
6.93%
Create a Home Valuation Report for This Property
The Home Valuation Report is an in-depth analysis detailing your home's value as well as a comparison with similar homes in the area
Home Values in the Area
Average Home Value in this Area
Purchase History
| Date | Buyer | Sale Price | Title Company |
|---|---|---|---|
| Randall And Debra Corbell Living Trust | $313 | None Listed On Document | |
| Corbell Randall D | $200,000 | Land Title Company | |
| Berry G A | $203,000 | Land Title Company |
Source: Public Records
Mortgage History
| Date | Status | Borrower | Loan Amount |
|---|---|---|---|
| Previous Owner | Corbell Randall D | $190,000 | |
| Previous Owner | Corbell Randall D | $190,000 | |
| Previous Owner | Corbell Randall D | $202,987 | |
| Previous Owner | Berry G A | $70,000 |
Source: Public Records
Tax History Compared to Growth
Tax History
| Year | Tax Paid | Tax Assessment Tax Assessment Total Assessment is a certain percentage of the fair market value that is determined by local assessors to be the total taxable value of land and additions on the property. | Land | Improvement |
|---|---|---|---|---|
| 2025 | $5,074 | $540,220 | $110,860 | $429,360 |
| 2024 | $4,935 | $540,220 | $110,860 | $429,360 |
| 2023 | $5,028 | $548,550 | $157,640 | $390,910 |
| 2022 | $4,844 | $465,960 | $133,900 | $332,060 |
| 2021 | $4,666 | $427,240 | $122,500 | $304,740 |
| 2020 | $4,628 | $429,730 | $113,010 | $316,720 |
| 2019 | $4,423 | $397,720 | $104,460 | $293,260 |
| 2018 | $4,752 | $355,860 | $88,980 | $266,880 |
| 2017 | $4,524 | $355,860 | $88,980 | $266,880 |
| 2016 | $4,383 | $318,620 | $88,980 | $229,640 |
| 2015 | $4,197 | $318,620 | $88,980 | $229,640 |
| 2014 | -- | $300,000 | $88,980 | $211,020 |
| 2013 | -- | $300,000 | $88,980 | $211,020 |
Source: Public Records
Map
Nearby Homes
- 7819 Amethyst Loop NW
- 8082 Daniel Place NW
- 0 Dickey Unit NWM2317395
- 4844 NW Walgren Dr
- 7911 Berry Ridge Rd NW
- 4495 Newberry Ln NW
- 5746 Londonderry Loop NW
- 4817 NW Iris Ln
- 5037 NW Cedarside Loop
- 5069 NW Cedarside Loop
- 5029 NW Cedarside Loop
- 5077 NW Cedarside Loop
- 8121 Berry Ridge Ln NW
- 5041 NW Knute Anderson Rd
- 5045 NW Cedarside Loop
- 5061 NW Cedarside Loop
- 5085 NW Cedarside Loop
- 5021 NW Cedarside Loop
- 5013 NW Cedarside Loop
- 8701 Schoolway Place NW
- 7896 Amethyst Loop NW
- 7896 Amethyst Loop NW
- 7743 Peridot Place NW
- 7725 Peridot Place NW
- 7902 Amethyst Loop NW
- 7737 Peridot Place NW
- 7867 Amethyst Loop NW
- 7732 Peridot Place NW
- 7861 Amethyst Loop NW
- 7726 Peridot Place NW
- 7908 Amethyst Loop NW
- 7744 Peridot Place NW
- 5107 NW Ebony Ct
- 7738 Peridot Place NW
- 7731 Peridot Place NW
- 7695 Kildare Loop NW
- 7701 Kildare Loop NW
- 7873 Amethyst Loop NW
- 7689 Kildare Loop NW
- 7914 Amethyst Loop NW