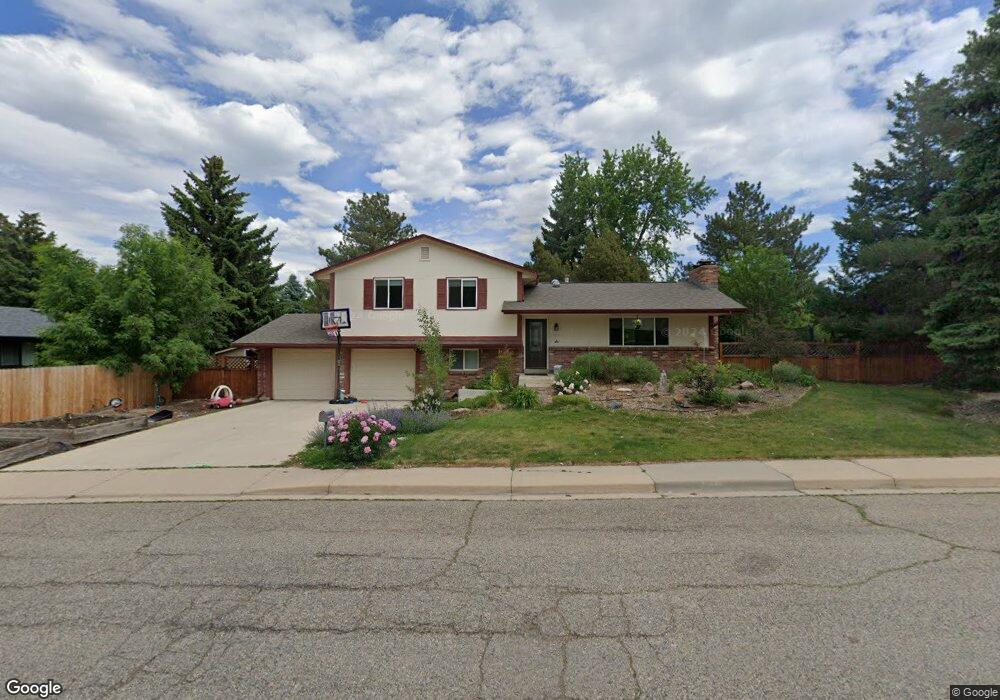
7899 Devonshire Way Boulder, CO 80301
Gunbarrel NeighborhoodEstimated Value: $651,000 - $759,000
3
Beds
3
Baths
1,757
Sq Ft
$401/Sq Ft
Est. Value
About This Home
This home is located at 7899 Devonshire Way, Boulder, CO 80301 and is currently estimated at $704,117, approximately $400 per square foot. 7899 Devonshire Way is a home located in Boulder County with nearby schools including Heatherwood Elementary School, Nevin Platt Middle School, and Boulder High School.
Ownership History
Date
Name
Owned For
Owner Type
Purchase Details
Closed on
Jan 14, 2011
Sold by
Shelton Peterson Llc
Bought by
Davis Keith Ofallon
Current Estimated Value
Home Financials for this Owner
Home Financials are based on the most recent Mortgage that was taken out on this home.
Original Mortgage
$216,000
Outstanding Balance
$136,982
Interest Rate
3.37%
Mortgage Type
New Conventional
Estimated Equity
$567,135
Purchase Details
Closed on
Sep 2, 2009
Sold by
Shelton Daniel L and Peterson Shelton Pamela
Bought by
Shelton Peterson Llc
Purchase Details
Closed on
Mar 24, 1995
Sold by
Peterson Shelton Pamela
Bought by
Peterson Shelton Pamela
Purchase Details
Closed on
Aug 18, 1986
Bought by
Davis Keith O'Fallon and Davis Kathryn Eileen
Purchase Details
Closed on
Jun 28, 1982
Bought by
Davis Keith O'Fallon and Davis Kathryn Eileen
Purchase Details
Closed on
Apr 26, 1978
Bought by
Davis Keith O'Fallon and Davis Kathryn Eileen
Create a Home Valuation Report for This Property
The Home Valuation Report is an in-depth analysis detailing your home's value as well as a comparison with similar homes in the area
Home Values in the Area
Average Home Value in this Area
Purchase History
| Date | Buyer | Sale Price | Title Company |
|---|---|---|---|
| Davis Keith Ofallon | $270,000 | Fidelity National Title Insu | |
| Shelton Peterson Llc | -- | None Available | |
| Peterson Shelton Pamela | -- | -- | |
| Davis Keith O'Fallon | -- | -- | |
| Davis Keith O'Fallon | -- | -- | |
| Davis Keith O'Fallon | $73,500 | -- |
Source: Public Records
Mortgage History
| Date | Status | Borrower | Loan Amount |
|---|---|---|---|
| Open | Davis Keith Ofallon | $216,000 |
Source: Public Records
Tax History
| Year | Tax Paid | Tax Assessment Tax Assessment Total Assessment is a certain percentage of the fair market value that is determined by local assessors to be the total taxable value of land and additions on the property. | Land | Improvement |
|---|---|---|---|---|
| 2025 | $3,856 | $41,806 | $22,881 | $18,925 |
| 2024 | $3,856 | $41,806 | $22,881 | $18,925 |
| 2023 | $3,792 | $41,560 | $25,360 | $19,886 |
| 2022 | $3,303 | $33,728 | $18,570 | $15,158 |
| 2021 | $3,150 | $34,699 | $19,105 | $15,594 |
| 2020 | $2,988 | $32,540 | $16,874 | $15,666 |
| 2019 | $2,942 | $32,540 | $16,874 | $15,666 |
| 2018 | $2,671 | $29,196 | $14,328 | $14,868 |
| 2017 | $2,592 | $32,277 | $15,840 | $16,437 |
| 2016 | $2,282 | $24,923 | $13,373 | $11,550 |
| 2015 | $2,168 | $22,623 | $10,428 | $12,195 |
| 2014 | $2,262 | $22,623 | $10,428 | $12,195 |
Source: Public Records
Map
Nearby Homes
- 7711 Devonshire Ct
- 7646 Concord Dr
- 4778 Berkshire St
- 4667 Ashfield Dr
- 4656 Tanglewood Trail
- 4788 Briar Ridge Trail
- 7401 Park Cir
- 4803 Briar Ridge Ct
- 7430 Clubhouse Rd
- 5152 Buckingham Rd
- 4936 Clubhouse Cir
- 5174 Buckingham Rd Unit L1
- 4883 Briar Ridge Ct
- 7481 Singing Hills Dr
- 4953 Clubhouse Ct
- 7434 Singing Hills Ct Unit J7434
- 7443 Singing Hills Ct Unit Q
- 4993 Clubhouse Ct
- 4311 Pali Way
- 7264 Siena Way Unit C
- 4656 Fordham Cir
- 4696 Fordham Cir
- 4676 Fordham Cir
- 7898 Devonshire Way
- 7878 Devonshire Way
- 4653 Greylock St
- 4633 Greylock St
- 4623 Greylock St
- 7868 Devonshire Way
- 4613 Greylock St
- 4663 Greylock St
- 4655 Fordham Cir
- 4643 Greylock St
- 4665 Fordham Cir
- 7858 Devonshire Way
- 4685 Fordham Cir
- 4695 Fordham Cir
- 4675 Fordham Cir
- 4603 Greylock St
- 7870 Grasmere Dr
Your Personal Tour Guide
Ask me questions while you tour the home.