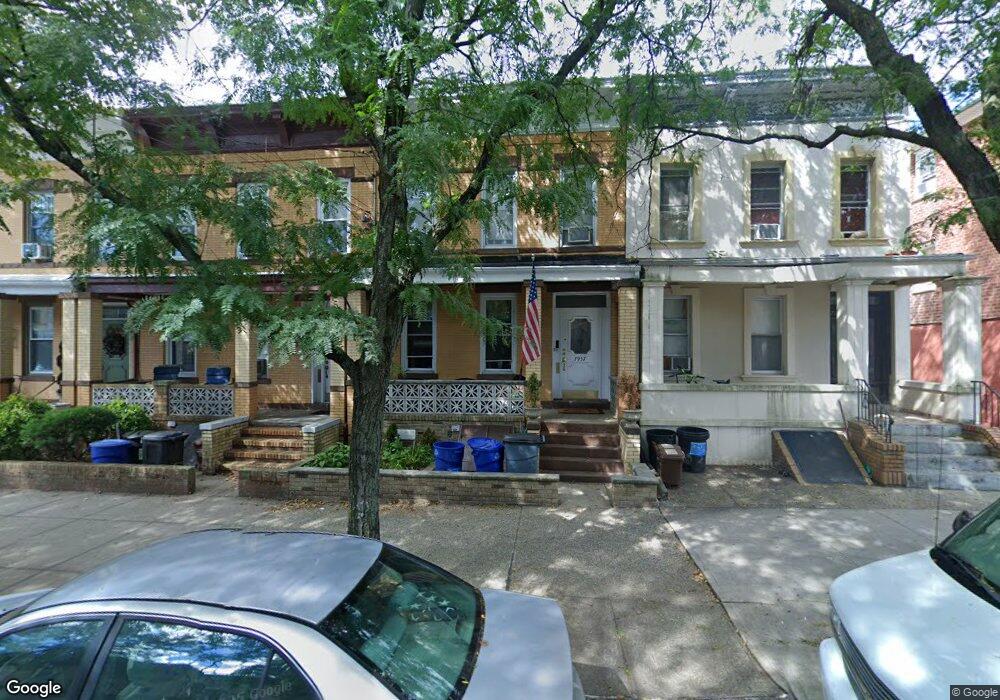
79-57 78th Ave Unit 2 Flushing, NY 11385
Glendale NeighborhoodEstimated Value: $829,554 - $1,115,000
3
Beds
1
Bath
2,000
Sq Ft
$487/Sq Ft
Est. Value
About This Home
This home is located at 79-57 78th Ave Unit 2, Flushing, NY 11385 and is currently estimated at $974,389, approximately $487 per square foot. 79-57 78th Ave Unit 2 is a home located in Queens County with nearby schools including I.S. 119 the Glendale and Elm Community Charter School.
Ownership History
Date
Name
Owned For
Owner Type
Purchase Details
Closed on
Jan 6, 2022
Sold by
Puoplo Linda and Puoplo Vincent
Bought by
Coronel Joel and Fretes-Coronel Reina
Current Estimated Value
Home Financials for this Owner
Home Financials are based on the most recent Mortgage that was taken out on this home.
Original Mortgage
$854,242
Outstanding Balance
$784,062
Interest Rate
3.11%
Mortgage Type
Purchase Money Mortgage
Estimated Equity
$190,327
Create a Home Valuation Report for This Property
The Home Valuation Report is an in-depth analysis detailing your home's value as well as a comparison with similar homes in the area
Home Values in the Area
Average Home Value in this Area
Purchase History
| Date | Buyer | Sale Price | Title Company |
|---|---|---|---|
| Coronel Joel | $870,000 | -- | |
| Coronel Joel | $870,000 | -- |
Source: Public Records
Mortgage History
| Date | Status | Borrower | Loan Amount |
|---|---|---|---|
| Open | Coronel Joel | $854,242 | |
| Closed | Coronel Joel | $854,242 |
Source: Public Records
Tax History
| Year | Tax Paid | Tax Assessment Tax Assessment Total Assessment is a certain percentage of the fair market value that is determined by local assessors to be the total taxable value of land and additions on the property. | Land | Improvement |
|---|---|---|---|---|
| 2025 | $7,426 | $39,161 | $10,747 | $28,414 |
| 2024 | $6,274 | $36,974 | $10,351 | $26,623 |
| 2023 | $7,081 | $35,254 | $9,412 | $25,842 |
| 2022 | $6,694 | $47,940 | $14,160 | $33,780 |
| 2021 | $7,057 | $49,980 | $14,160 | $35,820 |
| 2020 | $6,908 | $45,600 | $14,160 | $31,440 |
| 2019 | $6,446 | $50,220 | $14,160 | $36,060 |
| 2018 | $5,989 | $29,378 | $8,981 | $20,397 |
| 2017 | $5,697 | $27,945 | $10,973 | $16,972 |
| 2016 | $5,586 | $27,945 | $10,973 | $16,972 |
| 2015 | $3,180 | $27,195 | $13,343 | $13,852 |
| 2014 | $3,180 | $25,677 | $13,191 | $12,486 |
Source: Public Records
Map
Nearby Homes
Your Personal Tour Guide
Ask me questions while you tour the home.