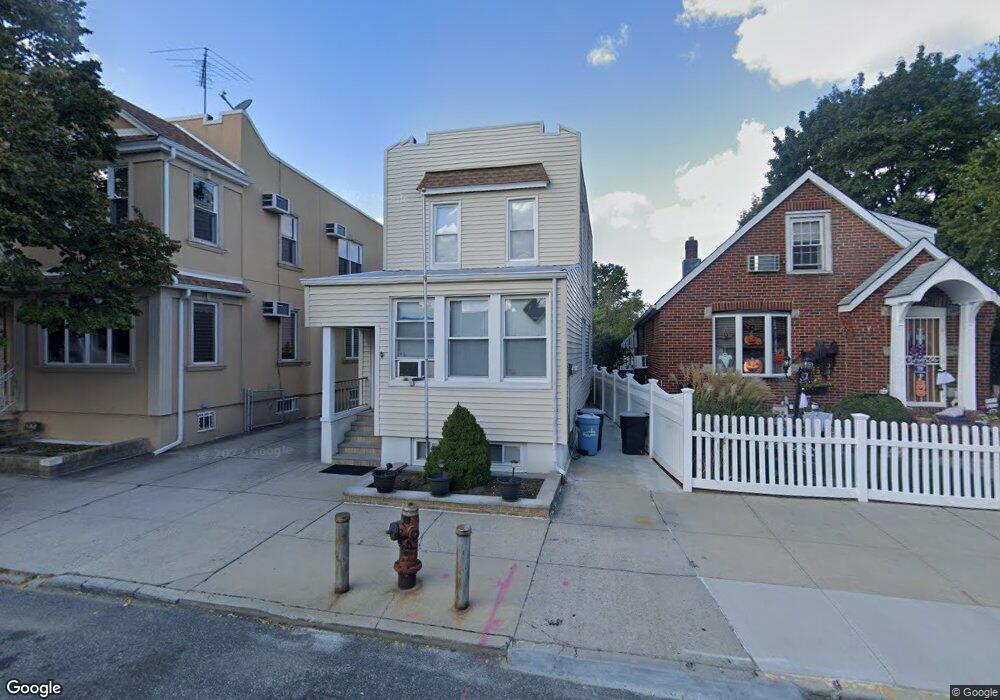
79-73 77th Rd Flushing, NY 11385
Glendale NeighborhoodEstimated Value: $734,444 - $830,000
2
Beds
2
Baths
1,216
Sq Ft
$648/Sq Ft
Est. Value
About This Home
This home is located at 79-73 77th Rd, Flushing, NY 11385 and is currently estimated at $787,861, approximately $647 per square foot. 79-73 77th Rd is a home located in Queens County with nearby schools including I.S. 119 the Glendale and Elm Community Charter School.
Ownership History
Date
Name
Owned For
Owner Type
Purchase Details
Closed on
Nov 24, 2014
Sold by
Romero Edith E
Bought by
Velez Luis A
Current Estimated Value
Home Financials for this Owner
Home Financials are based on the most recent Mortgage that was taken out on this home.
Original Mortgage
$327,037
Outstanding Balance
$250,337
Interest Rate
3.98%
Mortgage Type
New Conventional
Estimated Equity
$537,524
Purchase Details
Closed on
Oct 1, 2014
Sold by
Romero Edith E and Romero Vincent D
Bought by
Romero Edith E
Home Financials for this Owner
Home Financials are based on the most recent Mortgage that was taken out on this home.
Original Mortgage
$327,037
Outstanding Balance
$250,337
Interest Rate
3.98%
Mortgage Type
New Conventional
Estimated Equity
$537,524
Purchase Details
Closed on
Aug 11, 1999
Sold by
Steinbach George and Steinbach Marion
Bought by
Romero Vincent D and Romero Edith E
Home Financials for this Owner
Home Financials are based on the most recent Mortgage that was taken out on this home.
Original Mortgage
$152,000
Interest Rate
7.81%
Create a Home Valuation Report for This Property
The Home Valuation Report is an in-depth analysis detailing your home's value as well as a comparison with similar homes in the area
Home Values in the Area
Average Home Value in this Area
Purchase History
| Date | Buyer | Sale Price | Title Company |
|---|---|---|---|
| Velez Luis A | $436,050 | -- | |
| Romero Edith E | -- | -- | |
| Romero Vincent D | $175,000 | Fidelity National Title Ins |
Source: Public Records
Mortgage History
| Date | Status | Borrower | Loan Amount |
|---|---|---|---|
| Open | Velez Luis A | $327,037 | |
| Previous Owner | Romero Vincent D | $152,000 |
Source: Public Records
Tax History Compared to Growth
Tax History
| Year | Tax Paid | Tax Assessment Tax Assessment Total Assessment is a certain percentage of the fair market value that is determined by local assessors to be the total taxable value of land and additions on the property. | Land | Improvement |
|---|---|---|---|---|
| 2025 | $6,315 | $33,301 | $7,927 | $25,374 |
| 2024 | $6,315 | $31,440 | $8,969 | $22,471 |
| 2023 | $6,315 | $31,440 | $7,693 | $23,747 |
| 2022 | $6,224 | $41,940 | $11,040 | $30,900 |
| 2021 | $6,190 | $38,100 | $11,040 | $27,060 |
| 2020 | $5,874 | $38,100 | $11,040 | $27,060 |
| 2019 | $5,481 | $41,580 | $11,040 | $30,540 |
| 2018 | $5,341 | $26,200 | $7,532 | $18,668 |
| 2017 | $5,296 | $25,982 | $9,411 | $16,571 |
| 2016 | $4,900 | $25,982 | $9,411 | $16,571 |
| 2015 | $2,737 | $23,126 | $10,750 | $12,376 |
| 2014 | $2,737 | $21,834 | $11,107 | $10,727 |
Source: Public Records
Map
Nearby Homes