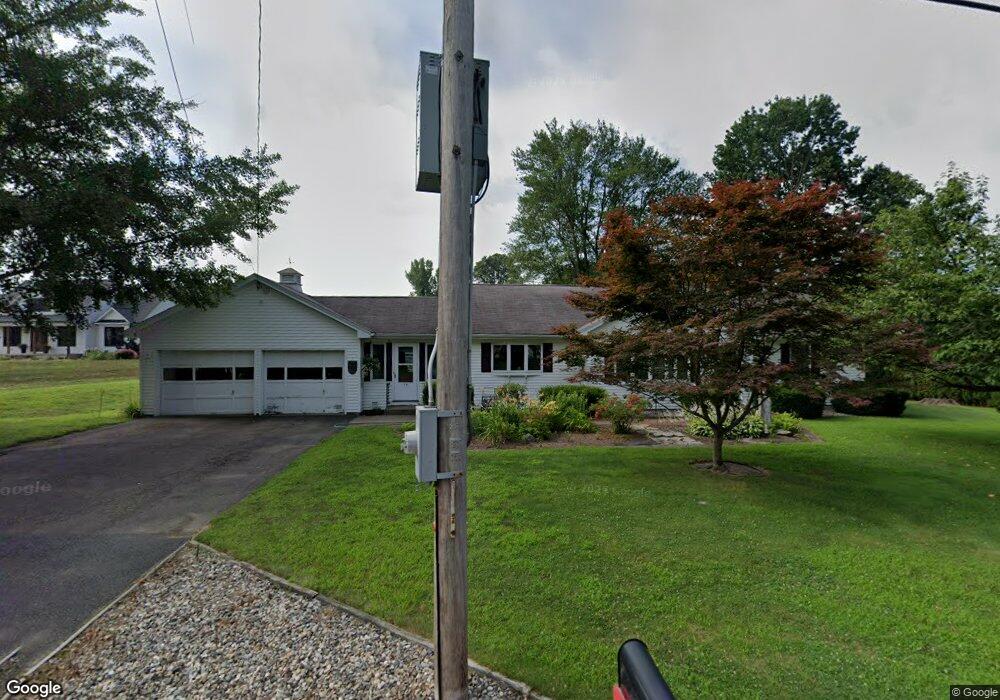
79 Bridge St Hatfield, MA 01038
Estimated Value: $485,000 - $519,000
3
Beds
3
Baths
1,676
Sq Ft
$301/Sq Ft
Est. Value
About This Home
This home is located at 79 Bridge St, Hatfield, MA 01038 and is currently estimated at $504,849, approximately $301 per square foot. 79 Bridge St is a home located in Hampshire County with nearby schools including Hatfield Elementary School, Smith Academy, and The Montessori School of Northampton.
Ownership History
Date
Name
Owned For
Owner Type
Purchase Details
Closed on
May 22, 2018
Sold by
Vollinger Mary R and Vollinger Mark E
Bought by
Vollinger Mark E
Current Estimated Value
Purchase Details
Closed on
Apr 1, 2016
Sold by
Vollinger Mary R
Bought by
Vollinger Mary R and Vollinger Mark E
Purchase Details
Closed on
Aug 6, 2015
Sold by
Vollinger Richard J and Vollinger Mary R
Bought by
Vollinger Mary R
Create a Home Valuation Report for This Property
The Home Valuation Report is an in-depth analysis detailing your home's value as well as a comparison with similar homes in the area
Home Values in the Area
Average Home Value in this Area
Purchase History
| Date | Buyer | Sale Price | Title Company |
|---|---|---|---|
| Vollinger Mark E | -- | -- | |
| Vollinger Mary R | -- | -- | |
| Vollinger Mary R | -- | -- |
Source: Public Records
Tax History
| Year | Tax Paid | Tax Assessment Tax Assessment Total Assessment is a certain percentage of the fair market value that is determined by local assessors to be the total taxable value of land and additions on the property. | Land | Improvement |
|---|---|---|---|---|
| 2025 | $6,015 | $434,600 | $159,700 | $274,900 |
| 2024 | $5,767 | $376,700 | $139,300 | $237,400 |
| 2023 | $4,783 | $354,800 | $132,300 | $222,500 |
| 2022 | $4,529 | $331,300 | $125,600 | $205,700 |
| 2021 | $492 | $304,900 | $114,300 | $190,600 |
| 2020 | $4,125 | $304,900 | $114,300 | $190,600 |
| 2019 | $466 | $285,800 | $112,100 | $173,700 |
| 2018 | $415 | $282,400 | $112,100 | $170,300 |
| 2017 | $412 | $280,700 | $112,100 | $168,600 |
| 2016 | $3,700 | $280,700 | $112,100 | $168,600 |
| 2015 | $3,553 | $269,800 | $100,800 | $169,000 |
| 2014 | $3,420 | $269,900 | $100,800 | $169,100 |
Source: Public Records
Map
Nearby Homes
- 71 Chestnut St
- 18 Elm St
- 43 Laurel Park Unit 43
- 149 Prospect St
- 0 Straits Rd
- 58 Main St Unit 4
- 58 Main St Unit 3
- 32 Stonewall Dr
- 59 N Hatfield Rd
- 88 Pines Edge Dr Unit 88
- 0 N Branch Rd
- 80 Damon Rd Unit 8201
- 80 Damon Rd Unit 5104
- 80 Damon Rd Unit 4302
- 11 West St
- 27 River Dr
- 26 Russell St Unit A-B
- 289 Hatfield St
- 151 Pantry Rd
- 22 Woodbine Ave
Your Personal Tour Guide
Ask me questions while you tour the home.