Estimated Value: $122,022 - $179,000
Studio
--
Bath
2,000
Sq Ft
$71/Sq Ft
Est. Value
About This Home
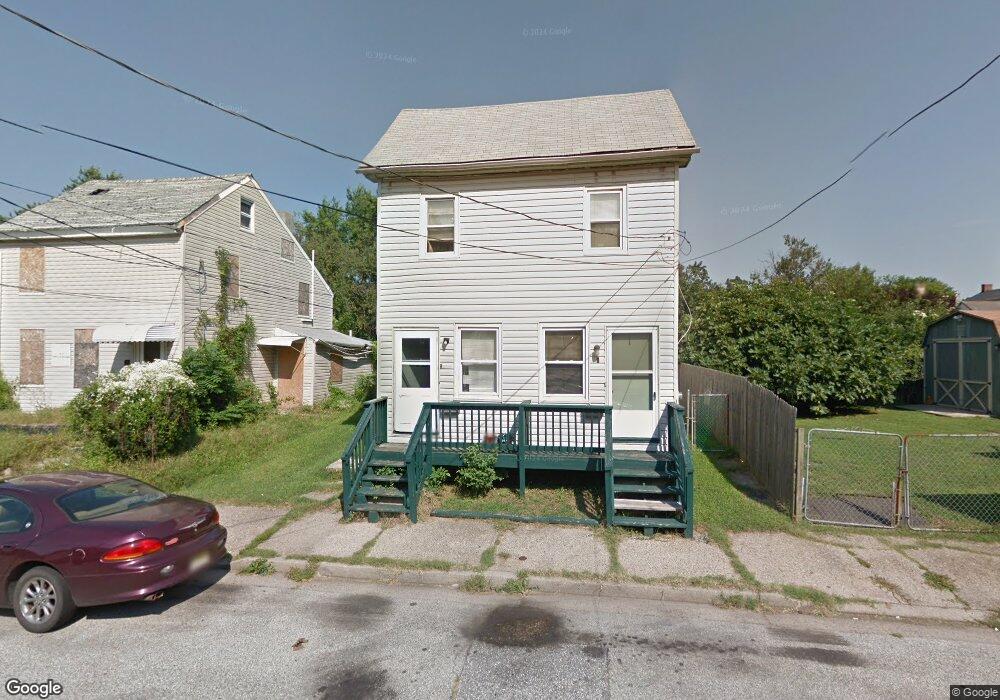
This home is located at 79 Elm St, Salem, NJ 08079 and is currently estimated at $142,756, approximately $71 per square foot. 79 Elm St is a home located in Salem County with nearby schools including John Fenwick Elementary School, Salem Middle School, and Salem High School.
Ownership History
Date
Name
Owned For
Owner Type
Purchase Details
Closed on
Mar 5, 2001
Sold by
Hud
Bought by
Mitchell Eric
Current Estimated Value
Purchase Details
Closed on
Jul 21, 2000
Sold by
Vancamp Richard
Bought by
Hud
Purchase Details
Closed on
Dec 5, 1996
Sold by
Burkett Lex J and Pryor Richard W
Bought by
Vancamp Richard
Home Financials for this Owner
Home Financials are based on the most recent Mortgage that was taken out on this home.
Original Mortgage
$55,100
Interest Rate
7.83%
Mortgage Type
FHA
Create a Home Valuation Report for This Property
The Home Valuation Report is an in-depth analysis detailing your home's value as well as a comparison with similar homes in the area
Home Values in the Area
Average Home Value in this Area
Purchase History
| Date | Buyer | Sale Price | Title Company |
|---|---|---|---|
| Mitchell Eric | $19,500 | Fidelity National Title Ins | |
| Hud | -- | -- | |
| Vancamp Richard | $28,000 | Franklin Title Agency Inc |
Source: Public Records
Mortgage History
| Date | Status | Borrower | Loan Amount |
|---|---|---|---|
| Previous Owner | Vancamp Richard | $55,100 |
Source: Public Records
Tax History
| Year | Tax Paid | Tax Assessment Tax Assessment Total Assessment is a certain percentage of the fair market value that is determined by local assessors to be the total taxable value of land and additions on the property. | Land | Improvement |
|---|---|---|---|---|
| 2025 | $2,902 | $35,300 | $7,500 | $27,800 |
| 2024 | $2,775 | $35,300 | $7,500 | $27,800 |
Source: Public Records
Map
Nearby Homes
Your Personal Tour Guide
Ask me questions while you tour the home.