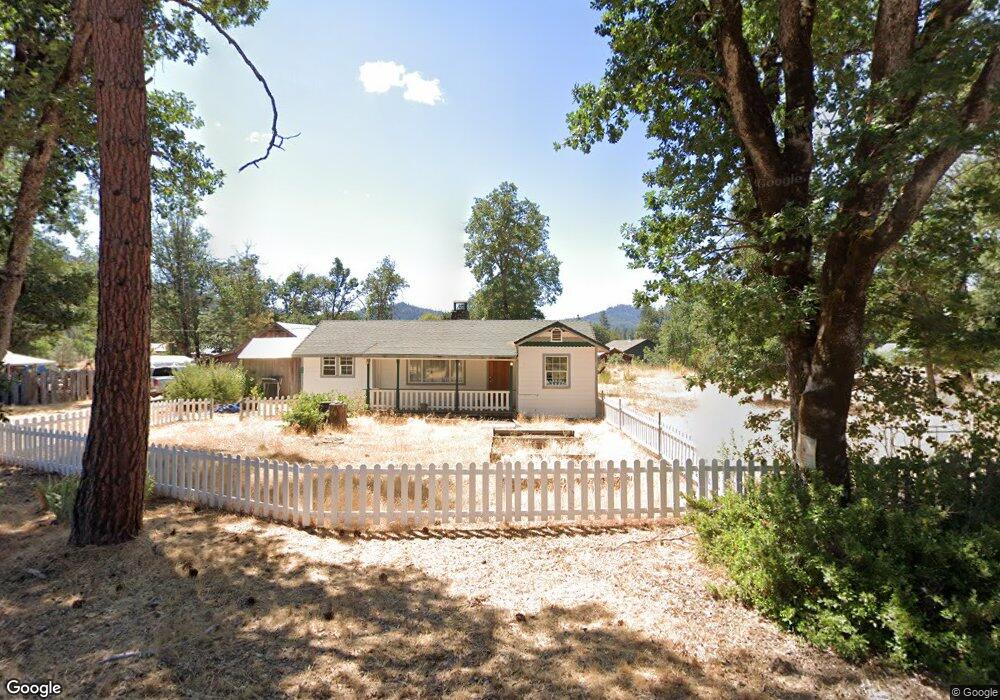
79 Humboldt St Hayfork, CA 96041
Estimated Value: $133,000 - $311,254
2
Beds
2
Baths
918
Sq Ft
$235/Sq Ft
Est. Value
About This Home
This home is located at 79 Humboldt St, Hayfork, CA 96041 and is currently estimated at $215,564, approximately $234 per square foot. 79 Humboldt St is a home with nearby schools including Hayfork High School.
Ownership History
Date
Name
Owned For
Owner Type
Purchase Details
Closed on
Jul 15, 2016
Sold by
Balbini Ossie J and Balbini Ossie J
Bought by
Balbini Ossie J
Current Estimated Value
Purchase Details
Closed on
Dec 21, 2007
Sold by
Balbini Ossie J and Balbini Ossie
Bought by
Balbini Ossie J
Purchase Details
Closed on
Jan 30, 2006
Sold by
Langberg Anona
Bought by
Balbini Ossie J
Home Financials for this Owner
Home Financials are based on the most recent Mortgage that was taken out on this home.
Original Mortgage
$50,000
Outstanding Balance
$28,165
Interest Rate
6.21%
Mortgage Type
Purchase Money Mortgage
Estimated Equity
$187,399
Create a Home Valuation Report for This Property
The Home Valuation Report is an in-depth analysis detailing your home's value as well as a comparison with similar homes in the area
Home Values in the Area
Average Home Value in this Area
Purchase History
| Date | Buyer | Sale Price | Title Company |
|---|---|---|---|
| Balbini Ossie J | -- | None Available | |
| Balbini Ossie J | -- | None Available | |
| Balbini Ossie J | $65,000 | First American Title Company |
Source: Public Records
Mortgage History
| Date | Status | Borrower | Loan Amount |
|---|---|---|---|
| Open | Balbini Ossie J | $50,000 |
Source: Public Records
Tax History
| Year | Tax Paid | Tax Assessment Tax Assessment Total Assessment is a certain percentage of the fair market value that is determined by local assessors to be the total taxable value of land and additions on the property. | Land | Improvement |
|---|---|---|---|---|
| 2025 | $2,496 | $209,151 | $79,101 | $130,050 |
| 2024 | $2,464 | $205,050 | $77,550 | $127,500 |
| 2023 | $2,464 | $201,030 | $76,030 | $125,000 |
| 2022 | $1,235 | $89,622 | $51,501 | $38,121 |
| 2021 | $1,157 | $87,866 | $50,492 | $37,374 |
| 2020 | $1,113 | $86,966 | $49,975 | $36,991 |
| 2019 | $1,093 | $85,262 | $48,996 | $36,266 |
| 2018 | $1,068 | $83,591 | $48,036 | $35,555 |
| 2017 | $1,065 | $81,953 | $47,095 | $34,858 |
| 2016 | $1,168 | $80,347 | $46,172 | $34,175 |
| 2015 | $1,022 | $79,141 | $45,479 | $33,662 |
| 2014 | $1,012 | $77,592 | $44,589 | $33,003 |
Source: Public Records
Map
Nearby Homes
- 53 Humboldt
- 37 Humboldt St
- 56 Manzanita Ave
- 7530 State Highway 3
- 120 Humboldt St
- 117 Manzanita Ave
- 7660 State Highway 3
- 7460 California 3
- 7560 State Highway 3
- 153 Manzanita Ave
- 122 Manzanita Ave
- 135 Humboldt St
- 86 Oak Ave
- 161 & 171 Manzanita
- 155 W Humboldt St
- 7691 State Highway 3
- 161, 171 Manzanita Ave
Your Personal Tour Guide
Ask me questions while you tour the home.