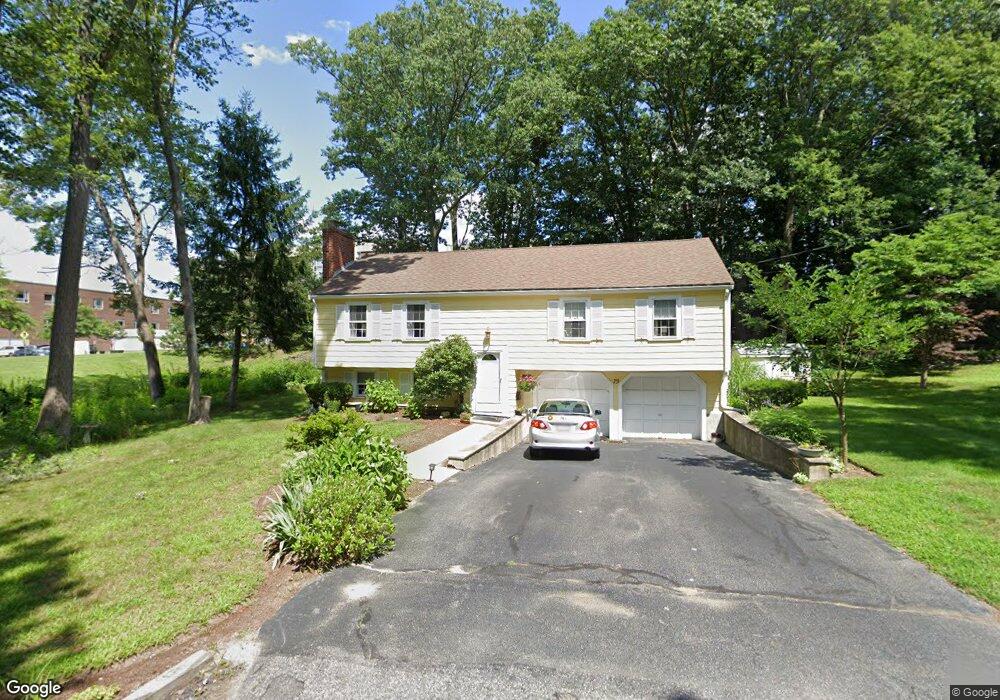
79 Longfellow Rd Reading, MA 01867
Estimated Value: $842,252 - $930,000
3
Beds
2
Baths
1,638
Sq Ft
$536/Sq Ft
Est. Value
About This Home
This home is located at 79 Longfellow Rd, Reading, MA 01867 and is currently estimated at $877,313, approximately $535 per square foot. 79 Longfellow Rd is a home located in Middlesex County with nearby schools including Birch Meadow Elementary School, Arthur W. Coolidge Middle School, and Reading Memorial High School.
Ownership History
Date
Name
Owned For
Owner Type
Purchase Details
Closed on
May 21, 2021
Sold by
Morris Ann M
Bought by
M Morris T A
Current Estimated Value
Purchase Details
Closed on
Nov 7, 2019
Sold by
Morris Richard F and Morris Ann M
Bought by
Morris Richard F and Morris Ann M
Purchase Details
Closed on
Jun 25, 1974
Bought by
Morris Richard F and Morris Ann M
Create a Home Valuation Report for This Property
The Home Valuation Report is an in-depth analysis detailing your home's value as well as a comparison with similar homes in the area
Home Values in the Area
Average Home Value in this Area
Purchase History
| Date | Buyer | Sale Price | Title Company |
|---|---|---|---|
| M Morris T A | -- | None Available | |
| Morris Richard F | -- | -- | |
| Morris Richard F | $42,300 | -- |
Source: Public Records
Mortgage History
| Date | Status | Borrower | Loan Amount |
|---|---|---|---|
| Previous Owner | Morris Richard F | $100,000 | |
| Previous Owner | Morris Richard F | $50,000 |
Source: Public Records
Tax History
| Year | Tax Paid | Tax Assessment Tax Assessment Total Assessment is a certain percentage of the fair market value that is determined by local assessors to be the total taxable value of land and additions on the property. | Land | Improvement |
|---|---|---|---|---|
| 2025 | $9,103 | $799,200 | $488,000 | $311,200 |
| 2024 | $8,999 | $767,800 | $468,800 | $299,000 |
| 2023 | $8,716 | $692,300 | $422,700 | $269,600 |
| 2022 | $8,389 | $629,300 | $384,200 | $245,100 |
| 2021 | $8,361 | $605,400 | $368,200 | $237,200 |
| 2020 | $8,037 | $576,100 | $350,400 | $225,700 |
| 2019 | $7,809 | $548,800 | $333,700 | $215,100 |
| 2018 | $7,178 | $517,500 | $314,700 | $202,800 |
| 2017 | $6,851 | $488,300 | $296,900 | $191,400 |
| 2016 | $6,409 | $442,000 | $268,200 | $173,800 |
| 2015 | $6,186 | $420,800 | $255,300 | $165,500 |
| 2014 | $5,771 | $391,500 | $237,500 | $154,000 |
Source: Public Records
Map
Nearby Homes
- 64 Longfellow Rd
- 35 Longfellow Rd
- 89 Grand St
- 863 Main St
- 115 Forest St
- 52 Sanborn St Unit 7
- 43 Ashley Place
- 150 Grove St
- 34 Plymouth Rd
- 119 Van Norden Rd
- 5 Washington St Unit D4
- 37 Fairchild Dr
- 69 Ash St
- 61 Beaver Rd
- 48 Village St Unit 1001
- 103 Orange St
- 430 West St
- 41 Winter St
- 45 Longview Rd
- 101 King St Unit 101
- 73 Longfellow Rd
- 67 Longfellow Rd
- 65 Longfellow Rd
- 65 Longfellow Rd Unit 1
- 68 Longfellow Rd
- 215 Bancroft Ave
- 63 Longfellow Rd
- 211 Bancroft Ave
- 205 Bancroft Ave
- 6 Oakland Rd
- 62 Longfellow Rd
- 4 Oakland Rd
- 199 Bancroft Ave
- 103 Hartshorn St
- 58 Longfellow Rd
- 212 Bancroft Ave
- 104 Hartshorn St
- 206 Bancroft Ave
- 193 Bancroft Ave
- 230 Bancroft Ave
Your Personal Tour Guide
Ask me questions while you tour the home.