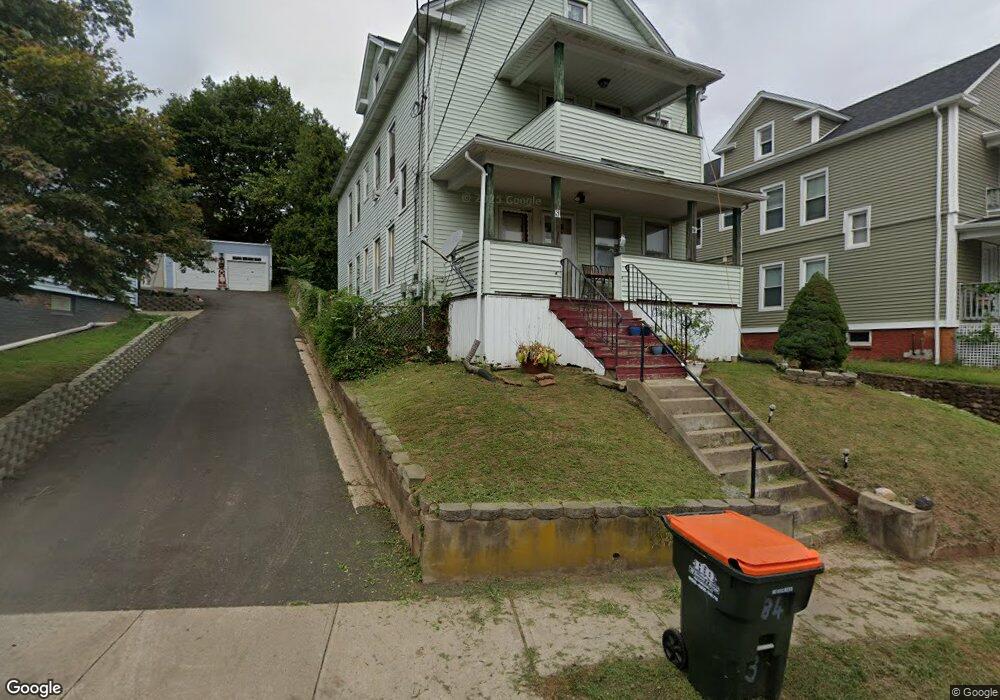
79 Spring St Meriden, CT 06451
Estimated Value: $296,097 - $340,000
4
Beds
3
Baths
2,730
Sq Ft
$117/Sq Ft
Est. Value
About This Home
This home is located at 79 Spring St, Meriden, CT 06451 and is currently estimated at $320,274, approximately $117 per square foot. 79 Spring St is a home located in New Haven County with nearby schools including Casimir Pulaski School, Lincoln Middle School, and Orville H. Platt High School.
Ownership History
Date
Name
Owned For
Owner Type
Purchase Details
Closed on
Mar 7, 2006
Sold by
Aboagye Agnes
Bought by
Campos Ricardo A
Current Estimated Value
Home Financials for this Owner
Home Financials are based on the most recent Mortgage that was taken out on this home.
Original Mortgage
$148,000
Outstanding Balance
$89,819
Interest Rate
7.55%
Estimated Equity
$230,455
Purchase Details
Closed on
Jun 29, 1998
Sold by
Morales Sergio and Morales Gloria
Bought by
Aboagye Agnes
Create a Home Valuation Report for This Property
The Home Valuation Report is an in-depth analysis detailing your home's value as well as a comparison with similar homes in the area
Home Values in the Area
Average Home Value in this Area
Purchase History
| Date | Buyer | Sale Price | Title Company |
|---|---|---|---|
| Campos Ricardo A | $185,000 | -- | |
| Aboagye Agnes | $69,000 | -- |
Source: Public Records
Mortgage History
| Date | Status | Borrower | Loan Amount |
|---|---|---|---|
| Open | Aboagye Agnes | $12,800 | |
| Open | Aboagye Agnes | $148,000 | |
| Closed | Aboagye Agnes | $37,000 | |
| Previous Owner | Aboagye Agnes | $136,800 |
Source: Public Records
Tax History
| Year | Tax Paid | Tax Assessment Tax Assessment Total Assessment is a certain percentage of the fair market value that is determined by local assessors to be the total taxable value of land and additions on the property. | Land | Improvement |
|---|---|---|---|---|
| 2025 | $4,830 | $127,400 | $26,530 | $100,870 |
| 2024 | $4,906 | $127,400 | $26,530 | $100,870 |
| 2023 | $4,729 | $127,400 | $26,530 | $100,870 |
| 2022 | $4,462 | $127,400 | $26,530 | $100,870 |
| 2021 | $3,468 | $79,660 | $20,090 | $59,570 |
| 2020 | $3,458 | $79,660 | $20,090 | $59,570 |
| 2019 | $3,429 | $79,660 | $20,090 | $59,570 |
| 2018 | $3,442 | $79,660 | $20,090 | $59,570 |
| 2017 | $3,350 | $79,660 | $20,090 | $59,570 |
| 2016 | $4,066 | $102,410 | $34,720 | $67,690 |
| 2015 | $3,960 | $102,130 | $34,440 | $67,690 |
| 2014 | $3,864 | $102,130 | $34,440 | $67,690 |
Source: Public Records
Map
Nearby Homes
Your Personal Tour Guide
Ask me questions while you tour the home.