Estimated Value: $163,360 - $243,000
--
Bed
--
Bath
3,182
Sq Ft
$65/Sq Ft
Est. Value
About This Home
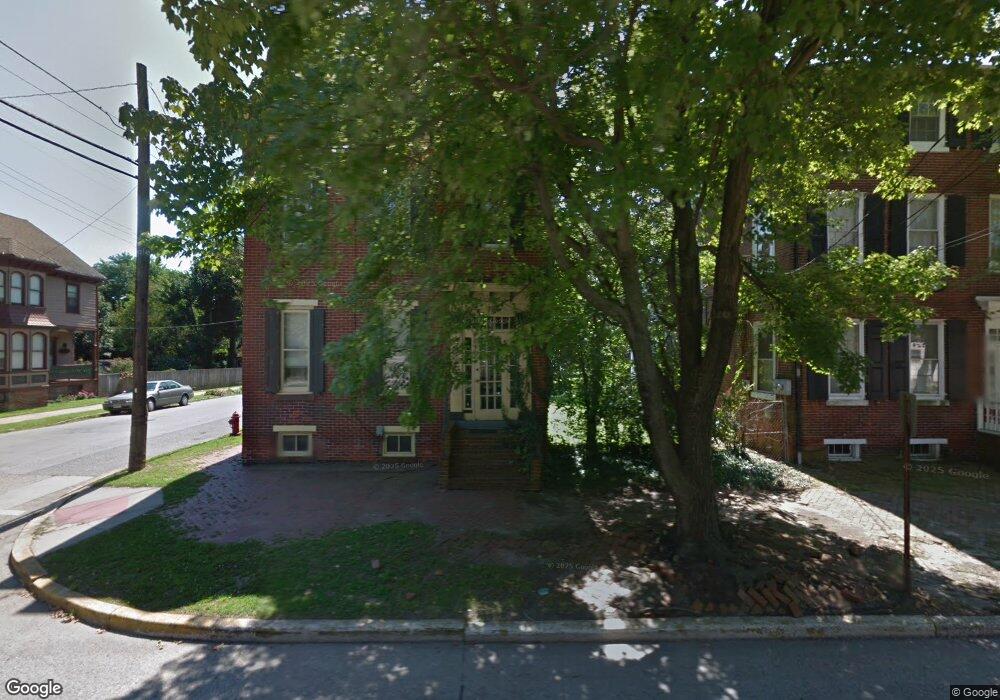
This home is located at 79 W Broadway, Salem, NJ 08079 and is currently estimated at $206,090, approximately $64 per square foot. 79 W Broadway is a home located in Salem County with nearby schools including John Fenwick Elementary School, Salem Middle School, and Salem High School.
Ownership History
Date
Name
Owned For
Owner Type
Purchase Details
Closed on
Jan 21, 2021
Sold by
City Of Salem
Bought by
Newton Elizabeth
Current Estimated Value
Purchase Details
Closed on
Nov 17, 2015
Sold by
Schweikert John E and Schweikert Kathleen M
Bought by
City Of Salem
Purchase Details
Closed on
Jan 28, 2004
Sold by
Cassidy Joan E Patrick
Bought by
Schwerkert John and Schwerkert Kathy
Purchase Details
Closed on
Jul 6, 1995
Sold by
Patrick James Robert
Bought by
Cassidy Joan E Patrick and Patrick Joan E
Create a Home Valuation Report for This Property
The Home Valuation Report is an in-depth analysis detailing your home's value as well as a comparison with similar homes in the area
Home Values in the Area
Average Home Value in this Area
Purchase History
| Date | Buyer | Sale Price | Title Company |
|---|---|---|---|
| Newton Elizabeth | $5,000 | Salem Oak Title Agency Inc | |
| Newton Elizabeth | $5,000 | Land Title | |
| City Of Salem | -- | Salem Oak Title Agency Inc | |
| Schwerkert John | $124,000 | Heritage Title & Abstract Ag | |
| Cassidy Joan E Patrick | -- | -- |
Source: Public Records
Tax History Compared to Growth
Tax History
| Year | Tax Paid | Tax Assessment Tax Assessment Total Assessment is a certain percentage of the fair market value that is determined by local assessors to be the total taxable value of land and additions on the property. | Land | Improvement |
|---|---|---|---|---|
| 2025 | $3,297 | $40,100 | $8,200 | $31,900 |
| 2024 | $3,152 | $40,100 | $8,200 | $31,900 |
| 2023 | $3,152 | $40,100 | $8,200 | $31,900 |
| 2022 | $3,014 | $40,100 | $8,200 | $31,900 |
| 2021 | $2,910 | $40,100 | $8,200 | $31,900 |
| 2020 | $0 | $40,100 | $8,200 | $31,900 |
| 2019 | $0 | $40,100 | $8,200 | $31,900 |
| 2018 | $0 | $40,100 | $8,200 | $31,900 |
| 2017 | $3,199 | $40,100 | $8,200 | $31,900 |
| 2016 | $6,399 | $163,400 | $16,400 | $147,000 |
| 2015 | $6,317 | $163,400 | $16,400 | $147,000 |
| 2014 | $6,284 | $163,400 | $16,400 | $147,000 |
Source: Public Records
Map
Nearby Homes