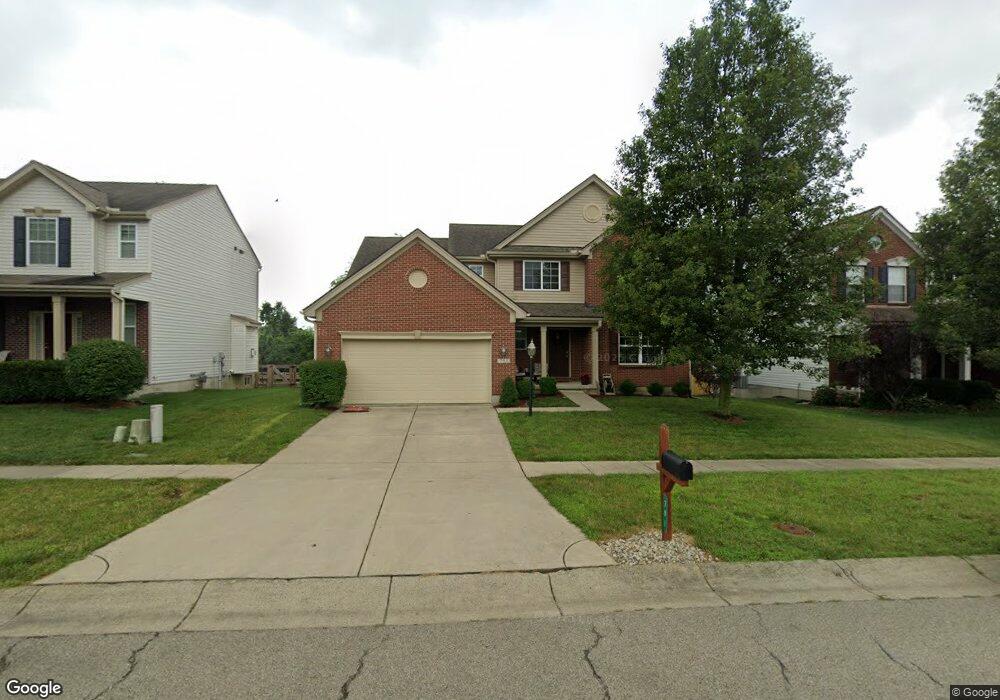
791 Elm Tree Dr Morrow, OH 45152
Estimated Value: $400,309 - $442,000
4
Beds
3
Baths
2,348
Sq Ft
$179/Sq Ft
Est. Value
About This Home
This home is located at 791 Elm Tree Dr, Morrow, OH 45152 and is currently estimated at $420,077, approximately $178 per square foot. 791 Elm Tree Dr is a home located in Warren County with nearby schools including Little Miami Early Childhood Center, Little Miami Intermediate Middle School, and Little Miami Middle School.
Ownership History
Date
Name
Owned For
Owner Type
Purchase Details
Closed on
Apr 29, 2009
Sold by
Inverness Group Incorporated
Bought by
Adamson Michael P
Current Estimated Value
Home Financials for this Owner
Home Financials are based on the most recent Mortgage that was taken out on this home.
Original Mortgage
$138,800
Outstanding Balance
$85,792
Interest Rate
4.85%
Mortgage Type
Purchase Money Mortgage
Estimated Equity
$334,285
Purchase Details
Closed on
Sep 26, 2007
Sold by
The Ryland Group Inc
Bought by
Inverness Group Inc
Home Financials for this Owner
Home Financials are based on the most recent Mortgage that was taken out on this home.
Original Mortgage
$15,000,000
Interest Rate
6.55%
Mortgage Type
Purchase Money Mortgage
Purchase Details
Closed on
Jan 24, 2006
Sold by
Towne Development Group Ltd
Bought by
Ryland Group Inc
Create a Home Valuation Report for This Property
The Home Valuation Report is an in-depth analysis detailing your home's value as well as a comparison with similar homes in the area
Home Values in the Area
Average Home Value in this Area
Purchase History
| Date | Buyer | Sale Price | Title Company |
|---|---|---|---|
| Adamson Michael P | $186,000 | Sterling Title & Associates | |
| Inverness Group Inc | $76,000 | Sterling Land Title Agency I | |
| Ryland Group Inc | $276,533 | Ryland Title Company |
Source: Public Records
Mortgage History
| Date | Status | Borrower | Loan Amount |
|---|---|---|---|
| Open | Adamson Michael P | $138,800 | |
| Previous Owner | Inverness Group Inc | $15,000,000 |
Source: Public Records
Tax History
| Year | Tax Paid | Tax Assessment Tax Assessment Total Assessment is a certain percentage of the fair market value that is determined by local assessors to be the total taxable value of land and additions on the property. | Land | Improvement |
|---|---|---|---|---|
| 2025 | $5,110 | $115,280 | $28,000 | $87,280 |
| 2024 | $5,110 | $115,280 | $28,000 | $87,280 |
| 2023 | $4,469 | $89,978 | $12,915 | $77,063 |
| 2022 | $4,418 | $89,978 | $12,915 | $77,063 |
| 2021 | $4,211 | $89,978 | $12,915 | $77,063 |
| 2020 | $4,010 | $73,154 | $10,500 | $62,654 |
| 2019 | $4,077 | $73,154 | $10,500 | $62,654 |
| 2018 | $3,995 | $73,154 | $10,500 | $62,654 |
| 2017 | $3,281 | $60,410 | $9,177 | $51,233 |
| 2016 | $3,361 | $60,410 | $9,177 | $51,233 |
| 2015 | $3,359 | $60,410 | $9,177 | $51,233 |
| 2014 | $3,802 | $60,410 | $9,180 | $51,230 |
| 2013 | $3,730 | $69,120 | $10,500 | $58,620 |
Source: Public Records
Map
Nearby Homes
- 668 Thornton Dr
- 723 Grande Oaks Dr
- 6250 Avebury Ct
- 1065 Dunstan Ct
- 873 E US Highway 22 and 3
- 616 Crabapple Ct
- 1327 Chelsea Ct
- 6671 Waverly Park
- 5598 Noble Ct
- 161 Arbor Glen Ct
- 5900 Driftwood Ct
- 5548 Castle Dr
- 5234 Highmeadow Place
- 5705 Pepperridge Ct
- 553 Auburn Grove Dr
- 1382 Brookchase Cir
- 477 Auburn Grove Dr
- 7000 Quellin Blvd
- 6824 Ohio 48
- 1123 Carrington Place
- 797 Elm Tree Dr
- 785 Elm Tree Dr
- 803 Elm Tree Dr
- 779 Elm Tree Dr
- 809 Elm Tree Dr
- 6251 Pine Cove
- 754 Elm Tree Dr
- 773 Elm Tree Dr
- 815 Elm Tree Dr
- 6257 Pine Cove
- 761 Elm Tree Dr
- 750 Elm Tree Dr
- 821 Elm Tree Dr
- 755 Elm Tree Dr
- 6252 Pine Cove
- 742 Elm Tree Dr
- 6263 Pine Cove
- 827 Elm Tree Dr
- 749 Elm Tree Dr
- 6258 Pine Cove
Your Personal Tour Guide
Ask me questions while you tour the home.