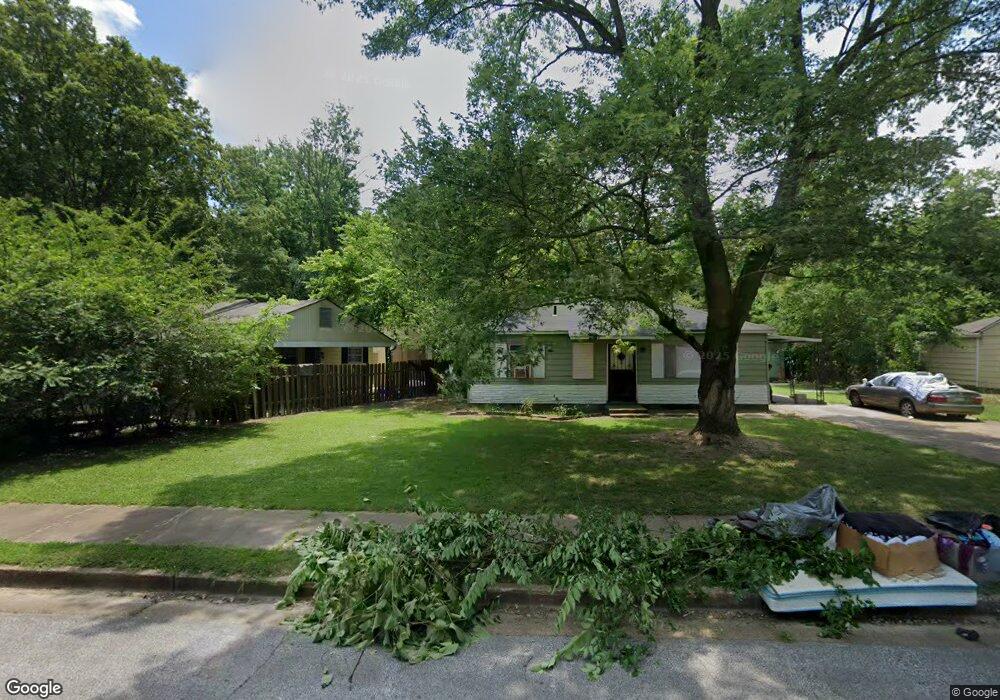
791 Par Ave Memphis, TN 38127
Frayser NeighborhoodEstimated Value: $51,426 - $112,000
3
Beds
2
Baths
1,439
Sq Ft
$52/Sq Ft
Est. Value
About This Home
This home is located at 791 Par Ave, Memphis, TN 38127 and is currently estimated at $74,607, approximately $51 per square foot. 791 Par Ave is a home located in Shelby County with nearby schools including Westside Elementary School, Grandview Heights Middle, and Trezevant High School.
Ownership History
Date
Name
Owned For
Owner Type
Purchase Details
Closed on
Nov 21, 2025
Sold by
Shinault Elnora Jones
Bought by
Mehmet Turkuzan
Current Estimated Value
Purchase Details
Closed on
Oct 6, 2008
Sold by
Citibank Na
Bought by
Shinaults Realty Inc
Purchase Details
Closed on
May 5, 2008
Sold by
Mosley Keenan J
Bought by
Citibank Na and Lxs 2006-1 Trust Fund
Purchase Details
Closed on
Jul 29, 1996
Sold by
Keel Garland and Keel Lois J
Bought by
Mitchell James W
Home Financials for this Owner
Home Financials are based on the most recent Mortgage that was taken out on this home.
Original Mortgage
$41,373
Interest Rate
8.26%
Mortgage Type
FHA
Create a Home Valuation Report for This Property
The Home Valuation Report is an in-depth analysis detailing your home's value as well as a comparison with similar homes in the area
Home Values in the Area
Average Home Value in this Area
Purchase History
| Date | Buyer | Sale Price | Title Company |
|---|---|---|---|
| Mehmet Turkuzan | $51,268 | Guardian Title | |
| Shinault Elnora Jones | -- | Guardian Title | |
| Shinaults Realty Inc | $7,500 | Associates Closing & Title | |
| Citibank Na | $39,200 | None Available | |
| Mitchell James W | $40,000 | -- | |
| Mitchell James W | $40,000 | -- |
Source: Public Records
Mortgage History
| Date | Status | Borrower | Loan Amount |
|---|---|---|---|
| Previous Owner | Mitchell James W | $41,373 |
Source: Public Records
Tax History
| Year | Tax Paid | Tax Assessment Tax Assessment Total Assessment is a certain percentage of the fair market value that is determined by local assessors to be the total taxable value of land and additions on the property. | Land | Improvement |
|---|---|---|---|---|
| 2025 | $373 | $16,900 | $1,625 | $15,275 |
| 2024 | $373 | $11,000 | $1,275 | $9,725 |
| 2023 | $670 | $11,000 | $1,275 | $9,725 |
| 2022 | $670 | $11,000 | $1,275 | $9,725 |
| 2021 | $678 | $11,000 | $1,275 | $9,725 |
| 2020 | $446 | $6,150 | $1,275 | $4,875 |
| 2019 | $446 | $6,150 | $1,275 | $4,875 |
| 2018 | $446 | $6,150 | $1,275 | $4,875 |
| 2017 | $301 | $7,325 | $1,275 | $6,050 |
| 2016 | $287 | $6,575 | $0 | $0 |
| 2014 | $287 | $6,575 | $0 | $0 |
Source: Public Records
Map
Nearby Homes
Your Personal Tour Guide
Ask me questions while you tour the home.