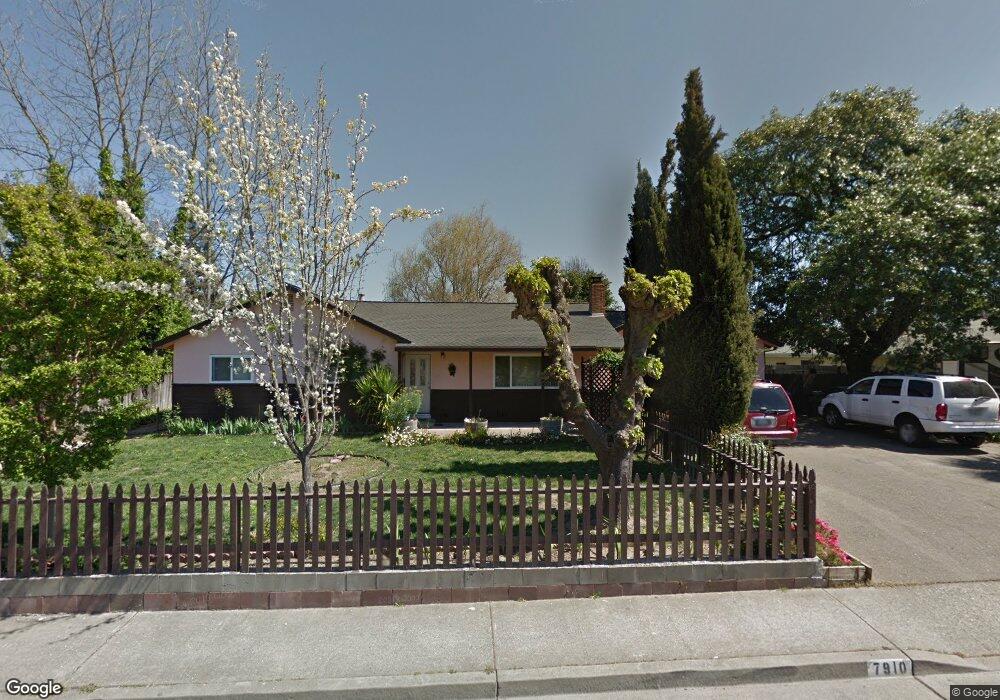
7910 Hembree Ln Windsor, CA 95492
Estimated Value: $633,000 - $741,000
3
Beds
2
Baths
1,298
Sq Ft
$528/Sq Ft
Est. Value
About This Home
This home is located at 7910 Hembree Ln, Windsor, CA 95492 and is currently estimated at $685,001, approximately $527 per square foot. 7910 Hembree Ln is a home located in Sonoma County with nearby schools including Mattie Washburn Elementary School, Brooks Elementary School, and Windsor Middle School.
Ownership History
Date
Name
Owned For
Owner Type
Purchase Details
Closed on
Mar 15, 2023
Sold by
Cornejo Nicolas and Cornejo Marisela
Bought by
Nicolas And Marisela Cornejo Living Trust
Current Estimated Value
Purchase Details
Closed on
Feb 16, 2001
Sold by
Davis Betty Lucille
Bought by
Aguirre Cornejo Nicolas and Aguirre Decornejo Marisela
Home Financials for this Owner
Home Financials are based on the most recent Mortgage that was taken out on this home.
Original Mortgage
$228,000
Interest Rate
6.89%
Create a Home Valuation Report for This Property
The Home Valuation Report is an in-depth analysis detailing your home's value as well as a comparison with similar homes in the area
Home Values in the Area
Average Home Value in this Area
Purchase History
| Date | Buyer | Sale Price | Title Company |
|---|---|---|---|
| Nicolas And Marisela Cornejo Living Trust | -- | -- | |
| Aguirre Cornejo Nicolas | $285,000 | New Century Title Co |
Source: Public Records
Mortgage History
| Date | Status | Borrower | Loan Amount |
|---|---|---|---|
| Previous Owner | Aguirre Cornejo Nicolas | $228,000 |
Source: Public Records
Tax History
| Year | Tax Paid | Tax Assessment Tax Assessment Total Assessment is a certain percentage of the fair market value that is determined by local assessors to be the total taxable value of land and additions on the property. | Land | Improvement |
|---|---|---|---|---|
| 2025 | $5,142 | $429,441 | $195,883 | $233,558 |
| 2024 | $5,142 | $421,022 | $192,043 | $228,979 |
| 2023 | $5,142 | $412,768 | $188,278 | $224,490 |
| 2022 | $4,960 | $404,676 | $184,587 | $220,089 |
| 2021 | $4,882 | $396,742 | $180,968 | $215,774 |
| 2020 | $4,991 | $392,675 | $179,113 | $213,562 |
| 2019 | $4,986 | $384,976 | $175,601 | $209,375 |
| 2018 | $4,918 | $377,428 | $172,158 | $205,270 |
| 2017 | $4,871 | $370,029 | $168,783 | $201,246 |
| 2016 | $4,607 | $362,774 | $165,474 | $197,300 |
| 2015 | $4,482 | $357,326 | $162,989 | $194,337 |
| 2014 | $4,051 | $319,000 | $146,000 | $173,000 |
Source: Public Records
Map
Nearby Homes
- 333 Cornell Stree
- 172 Cornell St
- 203 Cockrobin Ave
- 8148 D St
- 8156 D St
- 8147 Willow St
- 6516 Hwy
- 6424 Apollo Place
- 349 Sugar Maple Ln
- 8145 Willow St
- 125 Anish Way
- 1038 Capewood Ln
- 133 Bluebird Dr
- 8169 Willow St
- 123 Dartmouth Way
- 1138 Broadleaf Ln
- 127 Pleasant Ave
- 719 Hackberry Ct
- 8182 Willow St
- 345 Wilson Ln
Your Personal Tour Guide
Ask me questions while you tour the home.