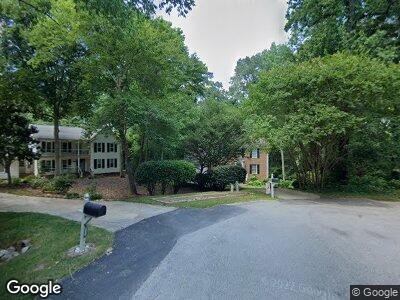
7913 Jenkins Ridge Ct Raleigh, NC 27613
Estimated Value: $585,679 - $627,000
4
Beds
3
Baths
2,416
Sq Ft
$249/Sq Ft
Est. Value
About This Home
This home is located at 7913 Jenkins Ridge Ct, Raleigh, NC 27613 and is currently estimated at $600,920, approximately $248 per square foot. 7913 Jenkins Ridge Ct is a home located in Wake County with nearby schools including Leesville Road Elementary School, Leesville Road Middle School, and Leesville Road High School.
Ownership History
Date
Name
Owned For
Owner Type
Purchase Details
Closed on
Feb 29, 2012
Sold by
Bellizzi Michael and Russ Jennifer
Bought by
Casteen Charles C and Casteen Krista K
Current Estimated Value
Home Financials for this Owner
Home Financials are based on the most recent Mortgage that was taken out on this home.
Original Mortgage
$248,900
Outstanding Balance
$174,199
Interest Rate
3.89%
Mortgage Type
New Conventional
Estimated Equity
$424,693
Purchase Details
Closed on
Jul 30, 1999
Sold by
Birckhead Robert M
Bought by
Bellizzi Michael and Bellizzi Jennifer
Home Financials for this Owner
Home Financials are based on the most recent Mortgage that was taken out on this home.
Original Mortgage
$100,000
Interest Rate
7.66%
Create a Home Valuation Report for This Property
The Home Valuation Report is an in-depth analysis detailing your home's value as well as a comparison with similar homes in the area
Home Values in the Area
Average Home Value in this Area
Purchase History
| Date | Buyer | Sale Price | Title Company |
|---|---|---|---|
| Casteen Charles C | $258,000 | None Available | |
| Bellizzi Michael | $202,500 | -- |
Source: Public Records
Mortgage History
| Date | Status | Borrower | Loan Amount |
|---|---|---|---|
| Open | Casteen Charles C | $248,900 | |
| Previous Owner | Bellizzi Michael A | $137,600 | |
| Previous Owner | Bellizzi Michael A | $50,000 | |
| Previous Owner | Bellizzi Michael A | $135,000 | |
| Previous Owner | Bellizzi Michael | $100,000 |
Source: Public Records
Tax History Compared to Growth
Tax History
| Year | Tax Paid | Tax Assessment Tax Assessment Total Assessment is a certain percentage of the fair market value that is determined by local assessors to be the total taxable value of land and additions on the property. | Land | Improvement |
|---|---|---|---|---|
| 2024 | $4,388 | $502,937 | $200,000 | $302,937 |
| 2023 | $3,530 | $321,973 | $98,000 | $223,973 |
| 2022 | $3,280 | $321,973 | $98,000 | $223,973 |
| 2021 | $3,153 | $321,973 | $98,000 | $223,973 |
| 2020 | $3,095 | $321,973 | $98,000 | $223,973 |
| 2019 | $3,270 | $280,420 | $107,000 | $173,420 |
| 2018 | $3,084 | $280,420 | $107,000 | $173,420 |
| 2017 | $2,937 | $280,420 | $107,000 | $173,420 |
| 2016 | $2,877 | $280,420 | $107,000 | $173,420 |
| 2015 | $2,857 | $274,021 | $102,000 | $172,021 |
| 2014 | $2,710 | $274,021 | $102,000 | $172,021 |
Source: Public Records
Map
Nearby Homes
- 7804 Tylerton Dr
- 8701 Oneal Rd
- 8326 Ray Rd
- 7929 Pine Timber Dr
- 8517 Evans Mill Place
- 8509 Oneal Rd
- 8418 Wheatstone Ln
- 4203 Norman Ridge Ln
- 4211 Norman Ridge Ln
- 8805 Leesville Rd
- 7117 Sandringham Dr
- 8713 Little Deer Ln
- 4704 Lancashire Dr
- 4500 Lancashire Dr
- 5305 Balmy Dawn Ct
- 7112 Benhart Dr
- 8840 Woodyhill Rd
- 2601 Brookstone Ridge Loop
- 4420 Tetbury Place
- 6036 Epping Forest Dr
- 7913 Jenkins Ridge Ct
- 7912 Jenkins Ridge Ct
- 7905 Jenkins Ridge Ct
- 7908 Jenkins Ridge Ct
- 8100 Fallston Ct
- 8104 Fallston Ct
- 7904 Jenkins Ridge Ct
- 4109 Glen Erin Way
- 4105 Glen Erin Way
- 4113 Glen Erin Way
- 7900 Jenkins Ridge Ct
- 7937 Kingsland Dr
- 7933 Kingsland Dr
- 8101 Fallston Ct
- 4124 Stagwood Dr
- 7929 Kingsland Dr
- 8108 Fallston Ct
- 4201 Samantha Dr
- 4101 Glen Erin Way
- 8105 Fallston Ct