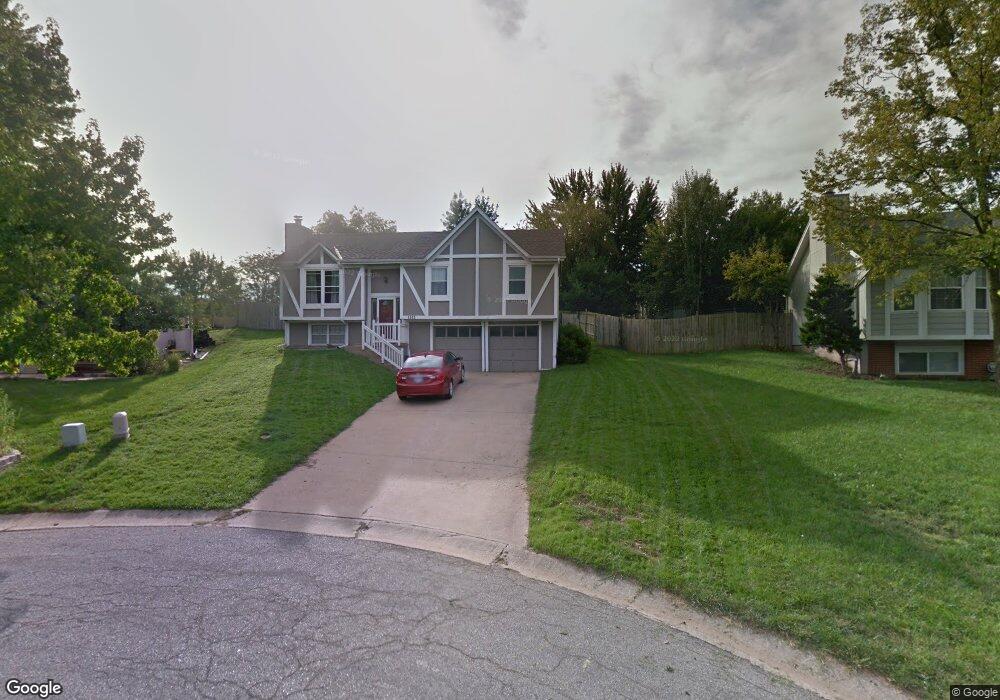
7913 Swarner Dr Lenexa, KS 66219
Estimated Value: $361,000 - $378,000
3
Beds
3
Baths
1,160
Sq Ft
$317/Sq Ft
Est. Value
About This Home
This home is located at 7913 Swarner Dr, Lenexa, KS 66219 and is currently estimated at $367,340, approximately $316 per square foot. 7913 Swarner Dr is a home located in Johnson County with nearby schools including Christa McAuliffe Elementary School, Westridge Middle School, and Shawnee Mission West High School.
Ownership History
Date
Name
Owned For
Owner Type
Purchase Details
Closed on
Jul 31, 2019
Sold by
Mckenney Richard and Mckenney Richard R
Bought by
Mckenney Molly C and Mckenney Molly
Current Estimated Value
Home Financials for this Owner
Home Financials are based on the most recent Mortgage that was taken out on this home.
Original Mortgage
$164,625
Outstanding Balance
$143,645
Interest Rate
3.73%
Mortgage Type
New Conventional
Estimated Equity
$223,695
Purchase Details
Closed on
May 10, 2004
Sold by
Reed Jeremy L and Reed Jennifer A M
Bought by
Mckenney Richard and Mckenney Molly
Home Financials for this Owner
Home Financials are based on the most recent Mortgage that was taken out on this home.
Original Mortgage
$156,702
Interest Rate
5.5%
Mortgage Type
Purchase Money Mortgage
Purchase Details
Closed on
Jun 11, 2001
Sold by
Rosen Brent H and Rosen Daiquiri R
Bought by
Reed Jeremy L
Create a Home Valuation Report for This Property
The Home Valuation Report is an in-depth analysis detailing your home's value as well as a comparison with similar homes in the area
Home Values in the Area
Average Home Value in this Area
Purchase History
| Date | Buyer | Sale Price | Title Company |
|---|---|---|---|
| Mckenney Molly C | -- | Assured Quality Title Co | |
| Mckenney Richard | -- | Security Land Title Company | |
| Reed Jeremy L | -- | Security Land Title Company |
Source: Public Records
Mortgage History
| Date | Status | Borrower | Loan Amount |
|---|---|---|---|
| Open | Mckenney Molly C | $164,625 | |
| Closed | Mckenney Richard | $156,702 |
Source: Public Records
Tax History Compared to Growth
Tax History
| Year | Tax Paid | Tax Assessment Tax Assessment Total Assessment is a certain percentage of the fair market value that is determined by local assessors to be the total taxable value of land and additions on the property. | Land | Improvement |
|---|---|---|---|---|
| 2024 | $4,205 | $38,100 | $8,078 | $30,022 |
| 2023 | $3,971 | $35,259 | $6,734 | $28,525 |
| 2022 | $3,693 | $32,752 | $6,123 | $26,629 |
| 2021 | $3,693 | $27,588 | $5,101 | $22,487 |
| 2020 | $3,216 | $26,703 | $5,101 | $21,602 |
| 2019 | $3,044 | $25,243 | $4,278 | $20,965 |
| 2018 | $2,892 | $23,748 | $4,278 | $19,470 |
| 2017 | $2,852 | $22,701 | $3,717 | $18,984 |
| 2016 | $2,696 | $21,171 | $3,543 | $17,628 |
| 2015 | $2,567 | $20,286 | $3,543 | $16,743 |
| 2013 | -- | $19,055 | $3,543 | $15,512 |
Source: Public Records
Map
Nearby Homes
- 8033 Hall St
- 15615 W 81st St
- 15322 W 83rd St
- 14828 W 83rd Place
- 15322 W 83rd Terrace
- 8403 Swarner Dr
- 14915 W 84th Terrace
- 15529 W 83rd Terrace
- 14620 W 84th St
- 15710 W 84th Terrace
- 7621 Lichtenauer Dr
- 8616 Baska Ct
- 14424 W 84th Terrace
- 7219 Allman Rd
- 7239 Allman Rd
- 7221 Allman Rd
- 7237 Allman Rd
- 7231 Allman Rd
- 15611 W 86th St
- 7325 Oakview St
- 7909 Swarner Dr
- 7917 Swarner Dr
- 7925 Swarner Dr
- 7921 Swarner Dr
- 7907 Swarner Dr
- 7931 Swarner Dr
- 7906 Swarner Dr
- 14952 Rhodes Cir
- 7910 Swarner Dr
- 7916 Swarner Dr
- 14956 Rhodes Cir
- 14948 Rhodes Cir
- 7922 Swarner Dr
- 15000 Rhodes Cir
- 7933 Swarner Dr
- 7935 Swarner Dr
- 14944 Rhodes Cir
- 7937 Swarner Dr
- 14940 Rhodes Cir
- 15004 Rhodes Cir