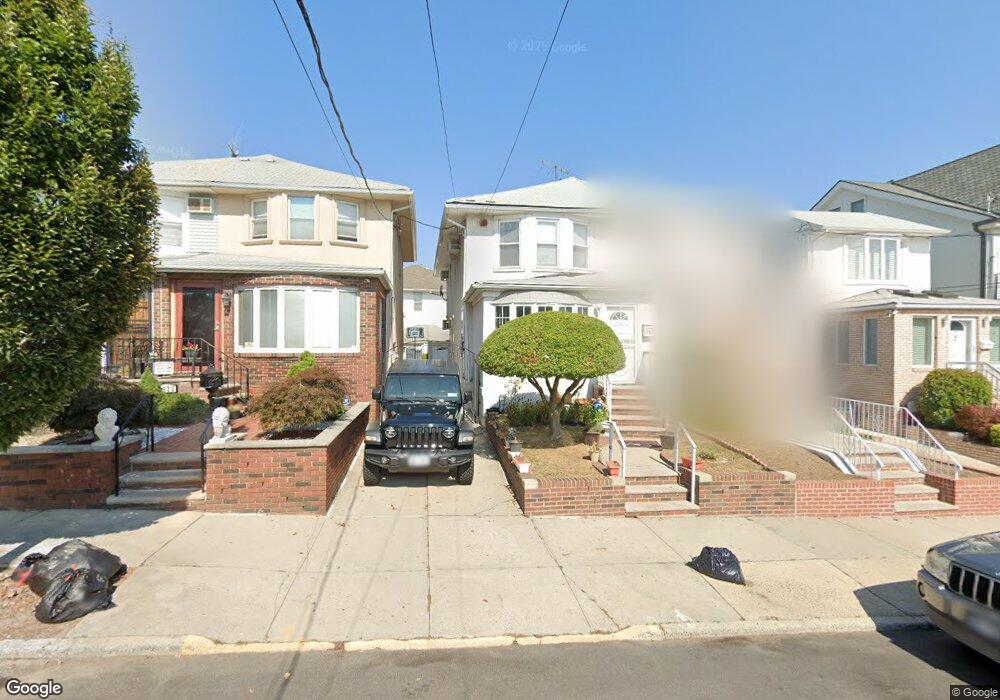
7918 11th Ave Brooklyn, NY 11228
Dyker Heights NeighborhoodEstimated Value: $1,243,000 - $1,445,000
--
Bed
--
Bath
2,234
Sq Ft
$593/Sq Ft
Est. Value
About This Home
This home is located at 7918 11th Ave, Brooklyn, NY 11228 and is currently estimated at $1,323,956, approximately $592 per square foot. 7918 11th Ave is a home located in Kings County with nearby schools including P.S. 127 McKinley Park, IS 201 Madeleine Brennan Intermediate School, and Fort Hamilton High School.
Ownership History
Date
Name
Owned For
Owner Type
Purchase Details
Closed on
Jan 17, 2001
Sold by
Lopinto Violet
Bought by
Maher Michael and Maher Lisa
Current Estimated Value
Home Financials for this Owner
Home Financials are based on the most recent Mortgage that was taken out on this home.
Original Mortgage
$220,000
Outstanding Balance
$78,814
Interest Rate
7.14%
Mortgage Type
Purchase Money Mortgage
Estimated Equity
$1,245,142
Create a Home Valuation Report for This Property
The Home Valuation Report is an in-depth analysis detailing your home's value as well as a comparison with similar homes in the area
Home Values in the Area
Average Home Value in this Area
Purchase History
| Date | Buyer | Sale Price | Title Company |
|---|---|---|---|
| Maher Michael | $275,000 | Commonwealth Land Title Ins |
Source: Public Records
Mortgage History
| Date | Status | Borrower | Loan Amount |
|---|---|---|---|
| Open | Maher Michael | $220,000 |
Source: Public Records
Tax History Compared to Growth
Tax History
| Year | Tax Paid | Tax Assessment Tax Assessment Total Assessment is a certain percentage of the fair market value that is determined by local assessors to be the total taxable value of land and additions on the property. | Land | Improvement |
|---|---|---|---|---|
| 2025 | $8,009 | $83,640 | $20,400 | $63,240 |
| 2024 | $8,009 | $107,880 | $20,400 | $87,480 |
| 2023 | $7,661 | $118,320 | $20,400 | $97,920 |
| 2022 | $7,094 | $96,840 | $20,400 | $76,440 |
| 2021 | $7,123 | $92,700 | $20,400 | $72,300 |
| 2020 | $5,342 | $90,660 | $20,400 | $70,260 |
| 2019 | $6,902 | $72,360 | $20,400 | $51,960 |
| 2018 | $6,348 | $32,602 | $13,307 | $19,295 |
| 2017 | $5,981 | $30,812 | $10,767 | $20,045 |
| 2016 | $5,563 | $29,378 | $11,173 | $18,205 |
| 2015 | $3,286 | $29,361 | $12,742 | $16,619 |
| 2014 | $3,286 | $28,663 | $14,842 | $13,821 |
Source: Public Records
Map
Nearby Homes