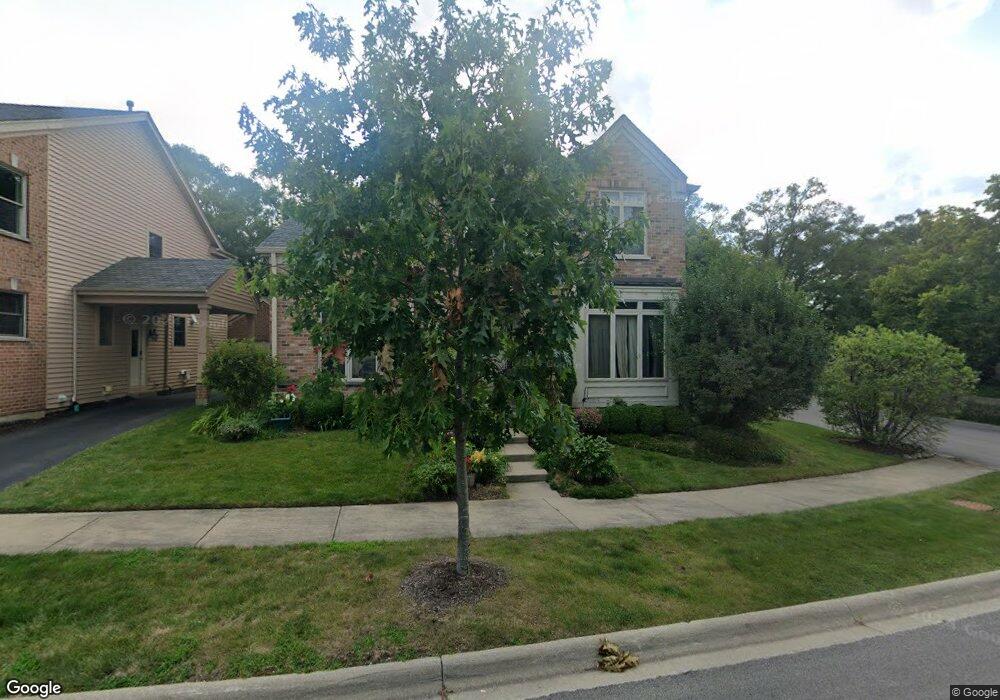
792 Deroo Loop Highwood, IL 60040
Estimated Value: $756,704 - $1,070,000
3
Beds
4
Baths
2,862
Sq Ft
$303/Sq Ft
Est. Value
About This Home
This home is located at 792 Deroo Loop, Highwood, IL 60040 and is currently estimated at $867,176, approximately $302 per square foot. 792 Deroo Loop is a home located in Lake County with nearby schools including Wayne Thomas Elementary School, Northwood Jr High School, and Highland Park High School.
Ownership History
Date
Name
Owned For
Owner Type
Purchase Details
Closed on
Jul 6, 2009
Sold by
Remot Francisca E and Remot Frances
Bought by
Remot Francisca and Remot Virgilio
Current Estimated Value
Purchase Details
Closed on
Oct 13, 1999
Sold by
Tfs Residential Ii Llc
Bought by
Remot Francisca E and Remot Frances
Home Financials for this Owner
Home Financials are based on the most recent Mortgage that was taken out on this home.
Original Mortgage
$188,000
Interest Rate
7.72%
Create a Home Valuation Report for This Property
The Home Valuation Report is an in-depth analysis detailing your home's value as well as a comparison with similar homes in the area
Home Values in the Area
Average Home Value in this Area
Purchase History
| Date | Buyer | Sale Price | Title Company |
|---|---|---|---|
| Remot Francisca | -- | None Available | |
| Remot Francisca E | $439,000 | Chicago Title Insurance Co |
Source: Public Records
Mortgage History
| Date | Status | Borrower | Loan Amount |
|---|---|---|---|
| Closed | Remot Francisca E | $188,000 |
Source: Public Records
Tax History
| Year | Tax Paid | Tax Assessment Tax Assessment Total Assessment is a certain percentage of the fair market value that is determined by local assessors to be the total taxable value of land and additions on the property. | Land | Improvement |
|---|---|---|---|---|
| 2024 | $13,640 | $196,556 | $35,391 | $161,165 |
| 2023 | $13,902 | $177,173 | $31,901 | $145,272 |
| 2022 | $13,902 | $170,822 | $35,045 | $135,777 |
| 2021 | $12,849 | $165,125 | $33,876 | $131,249 |
| 2020 | $12,549 | $165,125 | $33,876 | $131,249 |
| 2019 | $12,183 | $164,353 | $33,718 | $130,635 |
| 2018 | $12,381 | $173,724 | $34,975 | $138,749 |
| 2017 | $12,234 | $172,722 | $34,773 | $137,949 |
| 2016 | $11,727 | $164,435 | $33,105 | $131,330 |
| 2015 | $11,415 | $152,778 | $30,758 | $122,020 |
| 2014 | $12,143 | $162,425 | $34,607 | $127,818 |
| 2012 | $11,952 | $163,373 | $34,809 | $128,564 |
Source: Public Records
Map
Nearby Homes
- 3287 Western Ave
- 512 Hill St
- 535 Lockard Ln
- 525 Lockard Ln
- 0 Patten Rd
- 239 Sheridan Ave
- 34 Logan Loop Unit 242
- 3349 University Ave
- 840 Auburn Ct
- 25 Webster Ave
- 247 Highwood Ave
- 137 Highwood Ave
- 417 Temple Ave
- 927 Half Day Rd
- 1 Burtis Ave
- 0 Wrendale Ave Unit MRD12487576
- 1210 North Ave
- 1060 Livingston (Lot 5) Ave
- 1066 Livingston (Lot 2) Ave
- 1062 Livingston (Lot 4) Ave
- 786 Deroo Loop
- 780 Deroo Loop
- 790 Lyster Rd
- 790 Lyster Rd
- 766 Deroo Loop Unit 6
- 800 Lyster Rd
- 786 Lyster Rd
- 782 Lyster Rd
- 804 Deroo Loop
- 800 Deroo Loop
- 89 Westover Rd
- 778 Lyster Rd
- 83 Westover Rd
- 812 Lyster Rd
- 774 Lyster Rd
- 774 Lyster Rd Unit 1
- 758 Deroo Loop Unit 4
- 770 Lyster Rd
- 754 Deroo Loop Unit 3
- 77 Westover Rd