792 Dry Branch Rd Laurel Bloomery, TN 37680
Estimated Value: $128,000 - $339,254
--
Bed
1
Bath
688
Sq Ft
$342/Sq Ft
Est. Value
About This Home
This home is located at 792 Dry Branch Rd, Laurel Bloomery, TN 37680 and is currently estimated at $235,085, approximately $341 per square foot. 792 Dry Branch Rd is a home located in Johnson County with nearby schools including Johnson County Middle School and Johnson County High School.
Ownership History
Date
Name
Owned For
Owner Type
Purchase Details
Closed on
May 27, 1992
Sold by
Pennington Betty J and Eastridge Lois C
Bought by
Abel James C and Abel Raymond E
Current Estimated Value
Purchase Details
Closed on
May 2, 1969
Bought by
Able Lillard Heirs
Create a Home Valuation Report for This Property
The Home Valuation Report is an in-depth analysis detailing your home's value as well as a comparison with similar homes in the area
Home Values in the Area
Average Home Value in this Area
Purchase History
| Date | Buyer | Sale Price | Title Company |
|---|---|---|---|
| Abel James C | -- | None Listed On Document | |
| Able Lillard Heirs | -- | -- |
Source: Public Records
Tax History Compared to Growth
Tax History
| Year | Tax Paid | Tax Assessment Tax Assessment Total Assessment is a certain percentage of the fair market value that is determined by local assessors to be the total taxable value of land and additions on the property. | Land | Improvement |
|---|---|---|---|---|
| 2024 | $994 | $44,975 | $25,875 | $19,100 |
| 2023 | $994 | $44,975 | $25,875 | $19,100 |
| 2022 | $814 | $44,975 | $25,875 | $19,100 |
| 2021 | $814 | $44,975 | $25,875 | $19,100 |
| 2020 | $828 | $44,975 | $25,875 | $19,100 |
| 2019 | $828 | $40,400 | $23,875 | $16,525 |
| 2018 | $828 | $40,400 | $23,875 | $16,525 |
| 2017 | $828 | $40,400 | $23,875 | $16,525 |
| 2016 | $828 | $40,400 | $23,875 | $16,525 |
| 2015 | $731 | $40,400 | $23,875 | $16,525 |
| 2014 | $647 | $35,750 | $20,125 | $15,625 |
Source: Public Records
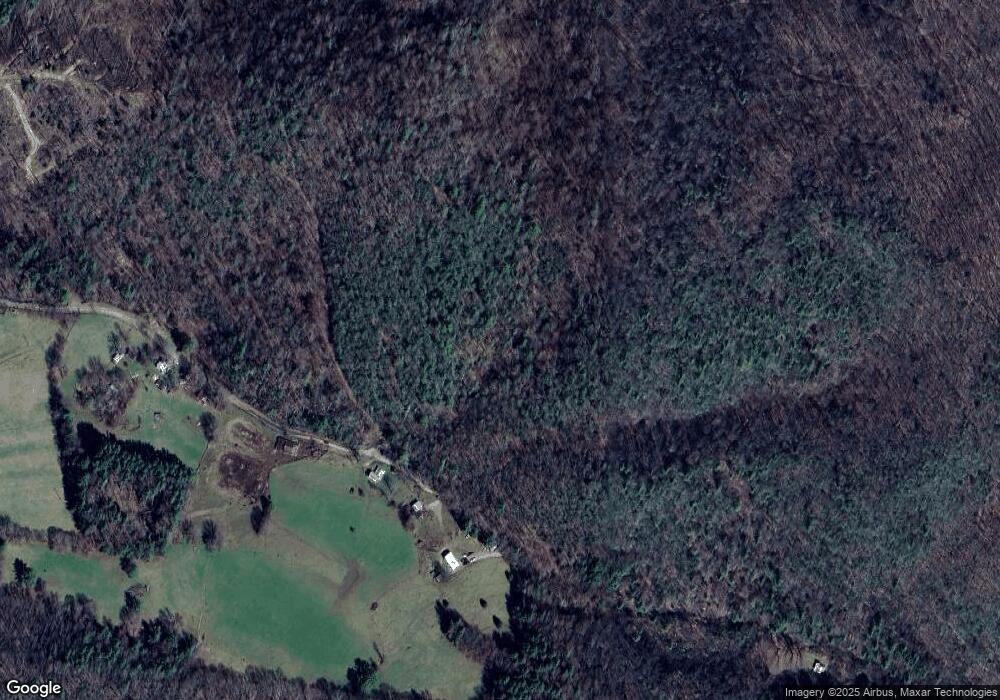
Map
Nearby Homes
- 812 Branch Rd
- 1441 Sugar Creek Rd
- 912 Hawkins Rd
- 24325 Jeb Stuart Hwy
- lot Tbd
- 864 Joe Clayton Rd
- 33974 Orchard Hill Rd
- Tbd Waters Rd
- 0 Waters Rd
- 1266 Flatwoods School Rd
- 23340 Beech Mountain Rd
- 808 Waddell Rd
- 406 Fritz St
- 1266 Flatwoods School Rd
- 222 Douglas Dr
- 706 E 2nd St
- 100 S Railroad Ave
- 1311 Deer Run Rd
- 1099 Deer Run Rd
- Joines Rd
- 792 Dry Branch Rd
- 0 Dry Branch Rd
- 421 Bishop Rd
- 368 Dry Branch Rd
- 362 Dry Branch Rd
- 399 Bishop Rd
- TBD Dry Branch Rd
- 000 Dry Branch Rd
- 317 Dry Branch Rd
- 318 Dry Branch Rd
- 4343 Taylors Valley Rd
- 3774 Sugar Creek Rd
- 3800 Sugar Creek Rd
- 225 Bishop Rd Unit 1
- 225 Bishop Rd
- 0 Bishop Rd
- TBD Taylors Valley Rd
- 363 Roy Widener Rd
- 4492 Taylors Valley Rd
- 179 Wilson Rd