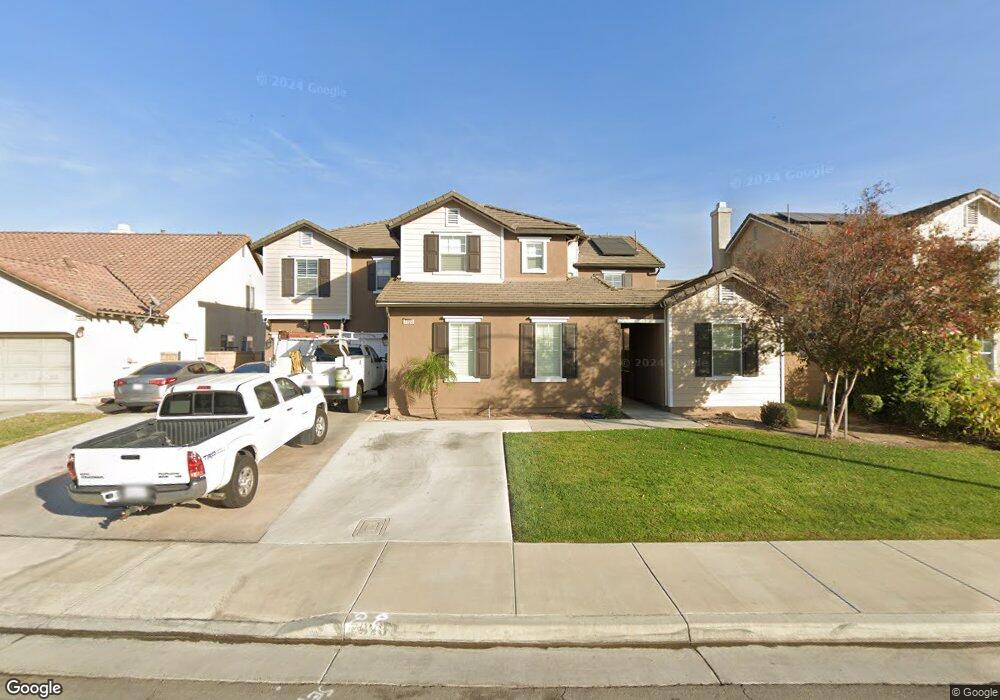
7920 Withers Way Corona, CA 92880
Estimated Value: $1,057,000 - $1,098,000
6
Beds
3
Baths
3,770
Sq Ft
$286/Sq Ft
Est. Value
About This Home
This home is located at 7920 Withers Way, Corona, CA 92880 and is currently estimated at $1,077,253, approximately $285 per square foot. 7920 Withers Way is a home located in Riverside County with nearby schools including Ronald Reagan Elementary, Dr. Augustine Ramirez Intermediate School, and Eleanor Roosevelt High School.
Ownership History
Date
Name
Owned For
Owner Type
Purchase Details
Closed on
Sep 4, 2008
Sold by
Hall Ryan C and Hall Andrea R
Bought by
Castellon Jose Ruben and Castillo Deisy Yolanda
Current Estimated Value
Home Financials for this Owner
Home Financials are based on the most recent Mortgage that was taken out on this home.
Original Mortgage
$355,200
Outstanding Balance
$235,918
Interest Rate
6.49%
Mortgage Type
Purchase Money Mortgage
Estimated Equity
$841,335
Purchase Details
Closed on
Jul 20, 2006
Sold by
Lennar Homes Of California Inc
Bought by
Hall Ryan C and Hall Andrea R
Home Financials for this Owner
Home Financials are based on the most recent Mortgage that was taken out on this home.
Original Mortgage
$503,992
Interest Rate
6.62%
Mortgage Type
Purchase Money Mortgage
Create a Home Valuation Report for This Property
The Home Valuation Report is an in-depth analysis detailing your home's value as well as a comparison with similar homes in the area
Home Values in the Area
Average Home Value in this Area
Purchase History
We collect this data history from publicly available records. To have your information removed, we recommend requesting removal directly through your county’s website.
| Date | Buyer | Sale Price | Title Company |
|---|---|---|---|
| Castellon Jose Ruben | $444,000 | Landwood Title | |
| Hall Ryan C | $630,000 | North American Title Company |
Source: Public Records
Mortgage History
We collect this data history from publicly available records. To have your information removed, we recommend requesting removal directly through your county’s website.
| Date | Status | Borrower | Loan Amount |
|---|---|---|---|
| Open | Castellon Jose Ruben | $355,200 | |
| Previous Owner | Hall Ryan C | $503,992 |
Source: Public Records
Tax History
| Year | Tax Paid | Tax Assessment Tax Assessment Total Assessment is a certain percentage of the fair market value that is determined by local assessors to be the total taxable value of land and additions on the property. | Land | Improvement |
|---|---|---|---|---|
| 2025 | $9,238 | $571,748 | $160,959 | $410,789 |
| 2023 | $9,238 | $549,548 | $154,709 | $394,839 |
| 2022 | $9,311 | $538,774 | $151,676 | $387,098 |
| 2021 | $9,151 | $528,210 | $148,702 | $379,508 |
| 2020 | $9,023 | $522,795 | $147,178 | $375,617 |
| 2019 | $8,892 | $512,545 | $144,293 | $368,252 |
| 2018 | $8,718 | $502,496 | $141,465 | $361,031 |
| 2017 | $8,571 | $492,644 | $138,692 | $353,952 |
| 2016 | $8,459 | $482,985 | $135,973 | $347,012 |
| 2015 | $8,304 | $475,732 | $133,932 | $341,800 |
| 2014 | $8,120 | $466,414 | $131,309 | $335,105 |
Source: Public Records
Map
Nearby Homes
- 7905 Saddletree Ct
- 7887 Withers Way
- 14611 Gannet St
- 14616 Meadowbrook Ln
- 14330 Wolfhound St
- 14333 Wolfhound St
- 14305 Chandler St
- 7930 Burrington St
- 14433 Eagle River Rd
- 14664 Walters St
- 14628 Walters St
- 14286 Fairchild Dr
- 7435 Silver Saddle Ct
- 8348 Fiske Dr
- 8224 Fieldstream Ct
- 8162 River Bluffs Ln
- 8822 Searcher St
- 8662 Toyon St
- 8587 Tamarack St
- 7252 Berry Creek St
- 7895 Saddletree Ct
- 7915 Saddletree Ct
- 7900 Withers Way
- 7890 Withers Way
- 7910 Withers Way
- 7925 Saddletree Ct
- 7885 Saddletree Ct
- 7908 Saddletree Ct
- 7898 Saddletree Ct
- 7918 Saddletree Ct
- 7880 Withers Way
- 7935 Saddletree Ct
- 7928 Saddletree Ct
- 7888 Saddletree Ct
- 7875 Saddletree Ct
- 7870 Withers Way
- 7930 Withers Way
- 7938 Saddletree Ct
- 7897 Hazelnut Dr
- 7868 Saddletree Ct
Your Personal Tour Guide
Ask me questions while you tour the home.