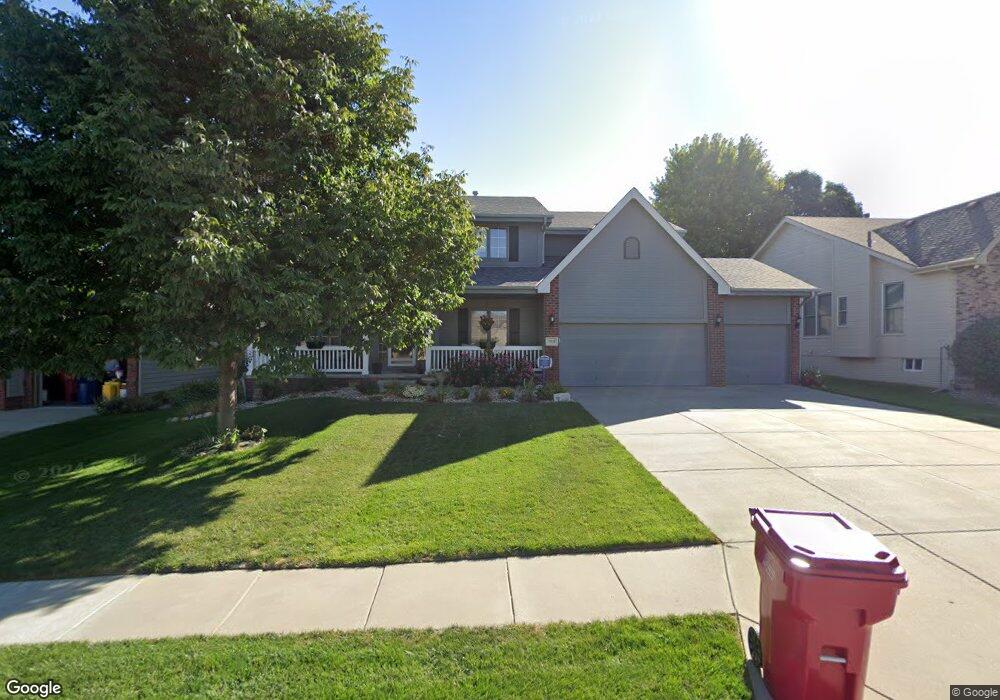
7931 S 169th St Omaha, NE 68136
Southwest Omaha NeighborhoodEstimated Value: $416,733 - $518,000
4
Beds
5
Baths
2,424
Sq Ft
$193/Sq Ft
Est. Value
About This Home
This home is located at 7931 S 169th St, Omaha, NE 68136 and is currently estimated at $467,933, approximately $193 per square foot. 7931 S 169th St is a home located in Sarpy County with nearby schools including Palisades Elementary School, Gretna Middle School, and Gretna High School.
Ownership History
Date
Name
Owned For
Owner Type
Purchase Details
Closed on
Jul 26, 2010
Sold by
Marasco Thomas A and Marasco Lori K
Bought by
Heck Joseph M and Heck Rebecca R
Current Estimated Value
Home Financials for this Owner
Home Financials are based on the most recent Mortgage that was taken out on this home.
Original Mortgage
$212,143
Outstanding Balance
$141,307
Interest Rate
4.69%
Estimated Equity
$326,626
Purchase Details
Closed on
Aug 22, 2002
Sold by
Rst Development Llc
Bought by
Dave Paik Builders Inc
Home Financials for this Owner
Home Financials are based on the most recent Mortgage that was taken out on this home.
Original Mortgage
$174,162
Interest Rate
6.41%
Purchase Details
Closed on
Jul 11, 2002
Sold by
Dave Paik Builders Inc
Bought by
Marasco Thomas A and Marasco Lori K
Home Financials for this Owner
Home Financials are based on the most recent Mortgage that was taken out on this home.
Original Mortgage
$174,162
Interest Rate
6.41%
Create a Home Valuation Report for This Property
The Home Valuation Report is an in-depth analysis detailing your home's value as well as a comparison with similar homes in the area
Home Values in the Area
Average Home Value in this Area
Purchase History
| Date | Buyer | Sale Price | Title Company |
|---|---|---|---|
| Heck Joseph M | $215,000 | Nlta | |
| Dave Paik Builders Inc | $30,000 | -- | |
| Marasco Thomas A | $218,000 | -- |
Source: Public Records
Mortgage History
| Date | Status | Borrower | Loan Amount |
|---|---|---|---|
| Open | Heck Joseph M | $212,143 | |
| Previous Owner | Marasco Thomas A | $174,162 |
Source: Public Records
Tax History Compared to Growth
Tax History
| Year | Tax Paid | Tax Assessment Tax Assessment Total Assessment is a certain percentage of the fair market value that is determined by local assessors to be the total taxable value of land and additions on the property. | Land | Improvement |
|---|---|---|---|---|
| 2025 | $7,082 | $362,604 | $60,000 | $302,604 |
| 2024 | $8,265 | $348,939 | $59,000 | $289,939 |
| 2023 | $8,265 | $342,823 | $51,000 | $291,823 |
| 2022 | $7,419 | $299,172 | $47,000 | $252,172 |
| 2021 | $6,625 | $267,997 | $45,000 | $222,997 |
| 2020 | $6,333 | $256,281 | $40,000 | $216,281 |
| 2019 | $6,400 | $249,456 | $40,000 | $209,456 |
| 2018 | $6,156 | $236,479 | $35,000 | $201,479 |
| 2017 | $6,039 | $233,357 | $30,000 | $203,357 |
| 2016 | $6,050 | $234,728 | $30,000 | $204,728 |
| 2015 | $5,964 | $224,037 | $30,000 | $194,037 |
| 2014 | $5,823 | $221,062 | $30,000 | $191,062 |
| 2012 | -- | $216,647 | $30,000 | $186,647 |
Source: Public Records
Map
Nearby Homes
- 7810 S 166th St
- 16528 Briar St
- 16521 Redwood St
- 7705 S 169th St
- 16904 Joanne Dr
- 16641 Olive St
- 7404 S 169th St
- 7501 S 170th St
- 7501 S 166th St
- 16603 Edna St
- 7820 S 173rd St
- 16334 Heather St
- 16307 Birch Ave
- 7734 S 162nd St
- 7216 S 170th St
- 7853 S 162nd St
- 7730 S 161st Terrace
- 8620 S 168th Ave
- 16125 Timberlane Dr
- 16130 Timberlane Dr
- 7931 169
- 7931 S 169 St
- 7927 S 169th St
- 7935 S 169th St
- 7910 S 168th Ave
- 7906 S 168th Ave
- 7923 S 169th St
- 7914 S 168th Ave
- 7930 S 169th St
- 7934 S 169th St
- 7926 S 169th St
- 7902 S 168th Ave
- 7817 S 169th St
- 7922 S 169th St
- 16809 Briar St
- 16805 Briar St
- 7820 S 168th Ave
- 16903 Briar St
- 16914 Briar St
- 16907 Briar St