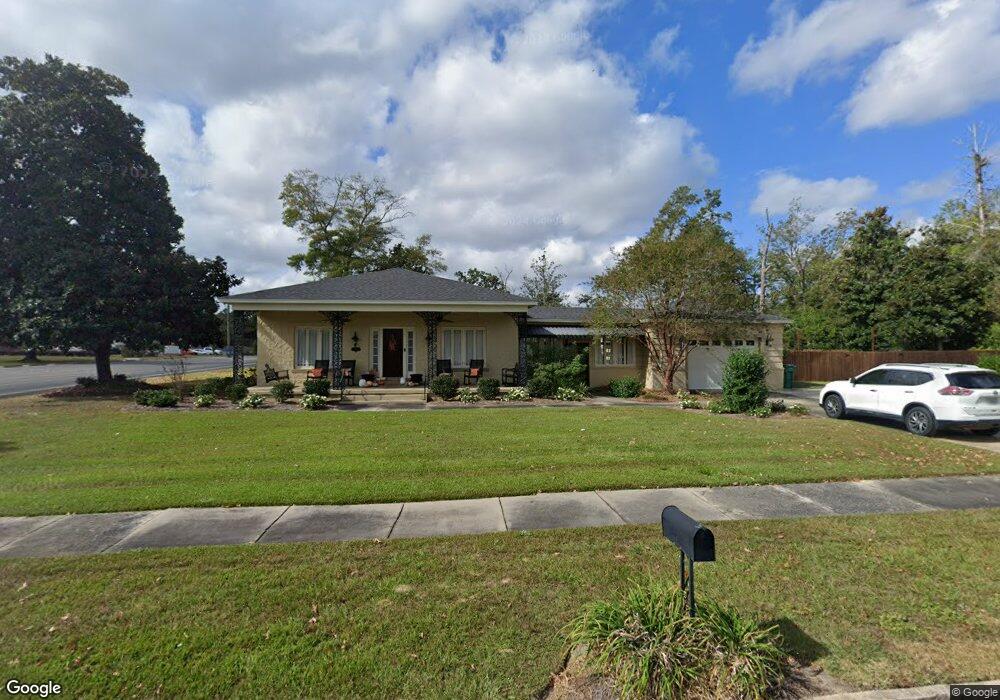
794 3rd St Chipley, FL 32428
Estimated Value: $269,000 - $323,287
3
Beds
2
Baths
2,060
Sq Ft
$143/Sq Ft
Est. Value
About This Home
This home is located at 794 3rd St, Chipley, FL 32428 and is currently estimated at $295,072, approximately $143 per square foot. 794 3rd St is a home located in Washington County with nearby schools including Kate M. Smith Elementary School, Vernon Elementary School, and Roulhac Middle School.
Ownership History
Date
Name
Owned For
Owner Type
Purchase Details
Closed on
May 16, 2018
Sold by
Corbin Kristine Marie and Trawick James Jeffrey
Bought by
Williams Ashley and Williams Wendy
Current Estimated Value
Home Financials for this Owner
Home Financials are based on the most recent Mortgage that was taken out on this home.
Original Mortgage
$188,880
Outstanding Balance
$161,932
Interest Rate
4.4%
Mortgage Type
New Conventional
Estimated Equity
$133,140
Purchase Details
Closed on
Jan 25, 2012
Sold by
Corbin Travis L
Bought by
Corbin Kristine Marie
Create a Home Valuation Report for This Property
The Home Valuation Report is an in-depth analysis detailing your home's value as well as a comparison with similar homes in the area
Home Values in the Area
Average Home Value in this Area
Purchase History
| Date | Buyer | Sale Price | Title Company |
|---|---|---|---|
| Williams Ashley | $236,100 | Panhandle Land Title Llc | |
| Trawick Kristine Corbin | -- | Panhandle Land Title Llc | |
| Corbin Kristine Marie | -- | None Available |
Source: Public Records
Mortgage History
| Date | Status | Borrower | Loan Amount |
|---|---|---|---|
| Open | Williams Ashley | $188,880 |
Source: Public Records
Tax History
| Year | Tax Paid | Tax Assessment Tax Assessment Total Assessment is a certain percentage of the fair market value that is determined by local assessors to be the total taxable value of land and additions on the property. | Land | Improvement |
|---|---|---|---|---|
| 2025 | $3,717 | $222,436 | -- | -- |
| 2024 | $3,638 | $228,761 | -- | -- |
| 2023 | $3,471 | $210,698 | $0 | $0 |
| 2022 | $3,316 | $206,679 | $0 | $0 |
| 2021 | $2,845 | $178,778 | $0 | $0 |
| 2020 | $2,378 | $155,345 | $0 | $0 |
| 2019 | $2,348 | $151,041 | $32,621 | $118,420 |
| 2018 | $1,450 | $107,992 | $0 | $0 |
| 2017 | $1,445 | $105,771 | $19,621 | $86,150 |
| 2016 | $1,479 | $106,213 | $0 | $0 |
| 2015 | $1,506 | $106,213 | $0 | $0 |
| 2014 | -- | $106,213 | $0 | $0 |
Source: Public Records
Map
Nearby Homes
- 794 2nd St
- 853 1st St
- 795 1st St
- 0000 South Blvd
- 815 5th St
- 0 Dellbrook Dr Unit 26285336
- 0 Greenview Ct
- Fox Hunt Rd
- 0 Main St Unit MFRO6291020
- 0 Main St Unit 711421
- 3831 Florida 77
- 6695 Florida 77
- 5750 Florida 77
- 4713 Florida 77
- 0000 Kelvin St
- 736 2nd St
- 896 Main St
- 807 Maple St
- 1217 Main St
- 0 Maple St
Your Personal Tour Guide
Ask me questions while you tour the home.