795 C St Penrose, CO 81240
Estimated Value: $355,000 - $425,000
3
Beds
1
Bath
1,154
Sq Ft
$344/Sq Ft
Est. Value
About This Home
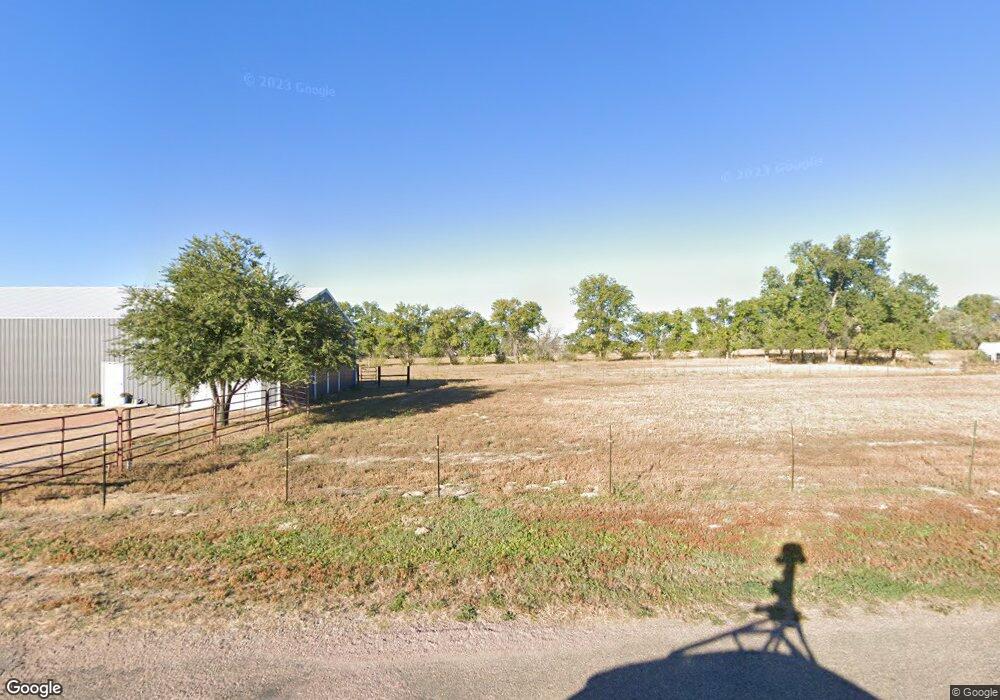
This home is located at 795 C St, Penrose, CO 81240 and is currently estimated at $396,953, approximately $343 per square foot. 795 C St is a home located in Fremont County with nearby schools including Penrose Elementary School and Florence High School.
Ownership History
Date
Name
Owned For
Owner Type
Purchase Details
Closed on
Jun 16, 2023
Sold by
Clark Carla J
Bought by
Marcy Wendi D and Lemons Michael N
Current Estimated Value
Home Financials for this Owner
Home Financials are based on the most recent Mortgage that was taken out on this home.
Original Mortgage
$356,000
Outstanding Balance
$349,536
Interest Rate
7.99%
Mortgage Type
Construction
Estimated Equity
$47,417
Purchase Details
Closed on
Jun 2, 2003
Sold by
Clark Herbert Cecil
Bought by
Clark Herbert Cecil and Clark Carla J
Create a Home Valuation Report for This Property
The Home Valuation Report is an in-depth analysis detailing your home's value as well as a comparison with similar homes in the area
Home Values in the Area
Average Home Value in this Area
Purchase History
| Date | Buyer | Sale Price | Title Company |
|---|---|---|---|
| Marcy Wendi D | $145,000 | None Listed On Document | |
| Clark Herbert Cecil | -- | None Available |
Source: Public Records
Mortgage History
| Date | Status | Borrower | Loan Amount |
|---|---|---|---|
| Open | Marcy Wendi D | $356,000 |
Source: Public Records
Tax History Compared to Growth
Tax History
| Year | Tax Paid | Tax Assessment Tax Assessment Total Assessment is a certain percentage of the fair market value that is determined by local assessors to be the total taxable value of land and additions on the property. | Land | Improvement |
|---|---|---|---|---|
| 2024 | $1,875 | $27,934 | $0 | $0 |
| 2023 | $1,875 | $11,894 | $0 | $0 |
| 2022 | $952 | $13,059 | $0 | $0 |
| 2021 | $964 | $13,435 | $0 | $0 |
| 2020 | $777 | $12,643 | $0 | $0 |
| 2019 | $780 | $12,643 | $0 | $0 |
| 2018 | $746 | $12,108 | $0 | $0 |
| 2017 | $759 | $12,108 | $0 | $0 |
| 2016 | $810 | $13,130 | $0 | $0 |
| 2015 | $800 | $13,130 | $0 | $0 |
| 2012 | -- | $13,796 | $7,156 | $6,640 |
Source: Public Records
Map
Nearby Homes