Estimated Value: $785,000 - $901,407
3
Beds
4
Baths
2,444
Sq Ft
$341/Sq Ft
Est. Value
About This Home
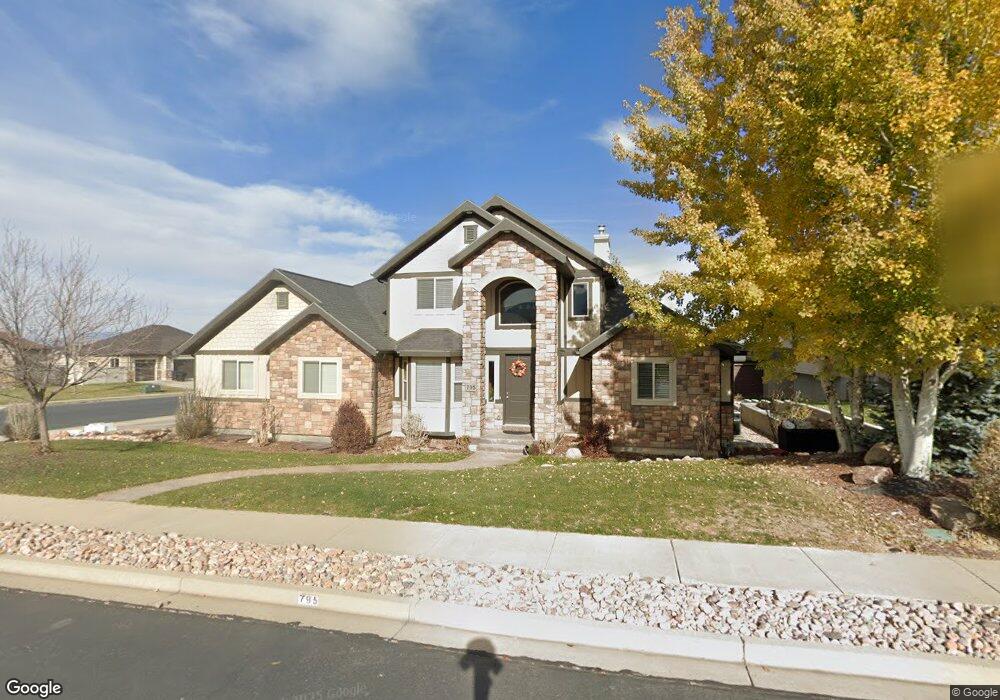
This home is located at 795 E 220 N, Salem, UT 84653 and is currently estimated at $834,469, approximately $341 per square foot. 795 E 220 N is a home with nearby schools including Salem Elementary, Valley View Middle School, and Salem Junior High School.
Ownership History
Date
Name
Owned For
Owner Type
Purchase Details
Closed on
Mar 15, 2011
Sold by
Terry Travis D
Bought by
Nixon David R
Current Estimated Value
Purchase Details
Closed on
Jan 26, 2007
Sold by
Salem Hills Llc
Bought by
Terry Travis D
Create a Home Valuation Report for This Property
The Home Valuation Report is an in-depth analysis detailing your home's value as well as a comparison with similar homes in the area
Home Values in the Area
Average Home Value in this Area
Purchase History
| Date | Buyer | Sale Price | Title Company |
|---|---|---|---|
| Nixon David R | -- | None Available | |
| Terry Travis D | -- | Affiliated First Title Comp |
Source: Public Records
Tax History
| Year | Tax Paid | Tax Assessment Tax Assessment Total Assessment is a certain percentage of the fair market value that is determined by local assessors to be the total taxable value of land and additions on the property. | Land | Improvement |
|---|---|---|---|---|
| 2025 | $4,284 | $502,535 | -- | -- |
| 2024 | $4,284 | $434,445 | $0 | $0 |
| 2023 | $4,281 | $434,885 | $0 | $0 |
| 2022 | $4,404 | $440,550 | $0 | $0 |
| 2021 | $3,498 | $561,500 | $128,300 | $433,200 |
| 2020 | $3,434 | $536,300 | $111,600 | $424,700 |
| 2019 | $3,335 | $531,900 | $108,000 | $423,900 |
| 2018 | $3,056 | $465,800 | $97,200 | $368,600 |
| 2017 | $3,382 | $274,945 | $0 | $0 |
| 2016 | $3,042 | $244,475 | $0 | $0 |
| 2015 | $3,022 | $238,535 | $0 | $0 |
| 2014 | $2,908 | $229,845 | $0 | $0 |
Source: Public Records
Map
Nearby Homes
- 2165 E 270 N Unit MSF47
- 2153 E 270 N Unit MSF48
- 2152 E 270 N Unit MSF50
- 2174 E 270 N Unit MSF51
- 2148 E 270 N Unit MSF49
- 643-1209 N 1850 E
- 384 N 710 E
- 659-1205 N 1850 E
- 6 Shady Ln
- 663-1204 N 1850 E
- 647-1208 N 1850 E
- 974 E 400 St N
- 974 E 400 St N Unit 1
- 84 N 500 E
- 438 N 500 E Unit LOT 2
- 315 N 500 E
- 644 N 500 E Unit 111
- 513 E 400 North St
- 846 E 400 St N
- 88 S 850 E
- 807 E 220 N
- 796 E 270 N
- 812 E 270 N Unit 44
- 796 E 220 N
- 237 N 780 E
- 821 E 220 N
- 221 N 780 E
- 814 E 220 N Unit 61
- 814 E 220 N
- 253 N 780 E Unit 42
- 253 N 780 E
- 253 780 E
- 858 E 270 N Unit 35
- 828 E 270 N Unit 45
- 828 E 270 N
- 203 N 780 E Unit 59
- 203 N 780 E
- 271 N 780 E Unit 41
- 271 N 780 E
- 841 E 220 N Unit 53
Your Personal Tour Guide
Ask me questions while you tour the home.