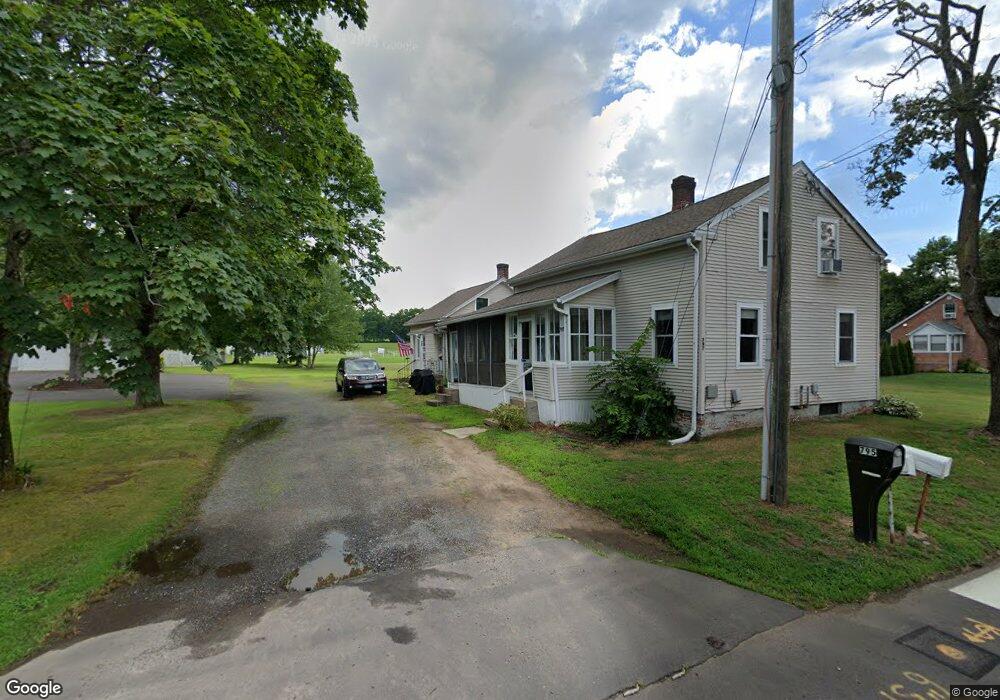
797 East St N Suffield, CT 06078
Estimated Value: $333,849 - $401,000
4
Beds
2
Baths
2,095
Sq Ft
$175/Sq Ft
Est. Value
About This Home
This home is located at 797 East St N, Suffield, CT 06078 and is currently estimated at $365,712, approximately $174 per square foot. 797 East St N is a home located in Hartford County with nearby schools including A. Ward Spaulding School, Mcalister Intermediate School, and Suffield Middle School.
Ownership History
Date
Name
Owned For
Owner Type
Purchase Details
Closed on
Nov 19, 2018
Sold by
Fleming James E Est
Bought by
James Fleming T
Current Estimated Value
Purchase Details
Closed on
Jun 4, 2018
Sold by
Fleming Real Estate Ll
Bought by
Fleming James B
Purchase Details
Closed on
Mar 22, 2017
Sold by
Fleming Shaun B
Bought by
Fleming Real Estate Ll
Purchase Details
Closed on
Mar 5, 2012
Sold by
Est Fleming James E
Bought by
James Fleming Ft and Butler Daniel J
Purchase Details
Closed on
Dec 10, 1996
Sold by
Oles Thecla Est
Bought by
Fleming James
Home Financials for this Owner
Home Financials are based on the most recent Mortgage that was taken out on this home.
Original Mortgage
$135,000
Interest Rate
8%
Mortgage Type
Unknown
Create a Home Valuation Report for This Property
The Home Valuation Report is an in-depth analysis detailing your home's value as well as a comparison with similar homes in the area
Home Values in the Area
Average Home Value in this Area
Purchase History
| Date | Buyer | Sale Price | Title Company |
|---|---|---|---|
| James Fleming T | -- | -- | |
| Fleming Shaun B | -- | -- | |
| Fleming James B | $80,000 | -- | |
| Fleming Real Estate Ll | -- | -- | |
| James Fleming Ft | -- | -- | |
| Fleming James | $150,000 | -- |
Source: Public Records
Mortgage History
| Date | Status | Borrower | Loan Amount |
|---|---|---|---|
| Previous Owner | Fleming James | $140,000 | |
| Previous Owner | Fleming James | $135,000 |
Source: Public Records
Tax History
| Year | Tax Paid | Tax Assessment Tax Assessment Total Assessment is a certain percentage of the fair market value that is determined by local assessors to be the total taxable value of land and additions on the property. | Land | Improvement |
|---|---|---|---|---|
| 2025 | $4,279 | $182,770 | $57,960 | $124,810 |
| 2024 | $4,136 | $182,770 | $57,960 | $124,810 |
| 2023 | $4,244 | $148,330 | $57,890 | $90,440 |
| 2022 | $4,244 | $148,330 | $57,890 | $90,440 |
| 2021 | $4,248 | $148,330 | $57,890 | $90,440 |
| 2020 | $4,248 | $148,330 | $57,890 | $90,440 |
| 2019 | $4,260 | $148,330 | $57,890 | $90,440 |
| 2018 | $4,493 | $153,230 | $55,580 | $97,650 |
| 2017 | $4,427 | $153,230 | $55,580 | $97,650 |
| 2016 | $4,321 | $153,230 | $55,580 | $97,650 |
| 2015 | $4,257 | $153,230 | $55,580 | $97,650 |
| 2014 | $4,156 | $153,230 | $55,580 | $97,650 |
Source: Public Records
Map
Nearby Homes
- 45 Douglas St
- 98 1st St
- 147 W Grayling Ln
- 3 Pebblestone Cir
- 24 Pebblestone Cir Unit 24
- 4 Pebblestone Cir
- 57 Asnuntuck St
- 80 S River St
- 40 Church St
- 30-32 Church St
- 26-28 Church St
- 97 Pleasant St
- 148 Pleasant St
- 69 Prospect St
- 60 Lincoln St
- 47 Maple Ave
- 127 Windsor St
- 39 Union Street Extension
- 41 Walnut St
- 278 Thompsonville Rd
Your Personal Tour Guide
Ask me questions while you tour the home.