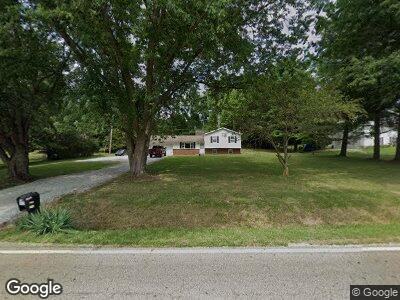
7982 Duncan Plains Rd Alexandria, OH 43001
Estimated Value: $259,298 - $387,000
3
Beds
2
Baths
1,104
Sq Ft
$298/Sq Ft
Est. Value
About This Home
This home is located at 7982 Duncan Plains Rd, Alexandria, OH 43001 and is currently estimated at $329,075, approximately $298 per square foot. 7982 Duncan Plains Rd is a home located in Licking County with nearby schools including Northridge Primary School, Northridge Middle School, and Northridge High School.
Ownership History
Date
Name
Owned For
Owner Type
Purchase Details
Closed on
Apr 14, 2017
Sold by
Berry Trevor L and Berry Briana L
Bought by
Hagans Kenneth
Current Estimated Value
Home Financials for this Owner
Home Financials are based on the most recent Mortgage that was taken out on this home.
Original Mortgage
$186,459
Interest Rate
4.4%
Mortgage Type
FHA
Purchase Details
Closed on
Jul 17, 2014
Sold by
Berry Travis A
Bought by
Berry Trevor L and Berry Briana L
Home Financials for this Owner
Home Financials are based on the most recent Mortgage that was taken out on this home.
Original Mortgage
$84,000
Interest Rate
4.2%
Mortgage Type
New Conventional
Purchase Details
Closed on
Sep 22, 2010
Sold by
Branch Mark S and Branch Kathy S
Bought by
Berry Travis A
Home Financials for this Owner
Home Financials are based on the most recent Mortgage that was taken out on this home.
Original Mortgage
$68,000
Interest Rate
4.42%
Mortgage Type
New Conventional
Create a Home Valuation Report for This Property
The Home Valuation Report is an in-depth analysis detailing your home's value as well as a comparison with similar homes in the area
Home Values in the Area
Average Home Value in this Area
Purchase History
| Date | Buyer | Sale Price | Title Company |
|---|---|---|---|
| Hagans Kenneth | $189,900 | Landsel Title Agency Inc | |
| Berry Trevor L | $157,500 | Ohio Title | |
| Berry Travis A | $85,000 | Chicago |
Source: Public Records
Mortgage History
| Date | Status | Borrower | Loan Amount |
|---|---|---|---|
| Open | Hagans Kenneth | $184,500 | |
| Closed | Hagans Kenneth | $186,459 | |
| Previous Owner | Berry Trevor L | $38,000 | |
| Previous Owner | Berry Trevor L | $84,000 | |
| Previous Owner | Berry Travis A | $68,000 |
Source: Public Records
Tax History Compared to Growth
Tax History
| Year | Tax Paid | Tax Assessment Tax Assessment Total Assessment is a certain percentage of the fair market value that is determined by local assessors to be the total taxable value of land and additions on the property. | Land | Improvement |
|---|---|---|---|---|
| 2024 | $4,012 | $66,020 | $18,730 | $47,290 |
| 2023 | $2,738 | $66,020 | $18,730 | $47,290 |
| 2022 | $2,547 | $54,250 | $11,200 | $43,050 |
| 2021 | $2,634 | $54,250 | $11,200 | $43,050 |
| 2020 | $2,647 | $54,250 | $11,200 | $43,050 |
| 2019 | $2,191 | $42,460 | $9,350 | $33,110 |
| 2018 | $1,944 | $0 | $0 | $0 |
| 2017 | $1,812 | $0 | $0 | $0 |
| 2016 | $1,580 | $0 | $0 | $0 |
| 2015 | $1,572 | $0 | $0 | $0 |
| 2014 | $2,193 | $0 | $0 | $0 |
| 2013 | $1,589 | $0 | $0 | $0 |
Source: Public Records
Map
Nearby Homes
- 3553 Hazelton Etna Rd
- 8610 Sadie Thomas Rd NW
- 4344 Hazelton Etna Rd
- 9311 Jug St NW
- 2519 Northridge Rd
- 8270 Windy Hollow Rd
- 2668 Mounts Rd NW
- 63 Mill St
- 4217 Caswell Rd
- 1345 Legend Ln
- 1060 S Watkins Rd
- 0 Smaller
- 6003 Nichols Ln
- 6016 Castle Rd
- 8028 Concord Rd
- 4135 Hardscrabble Rd
- 10621 Beaver Rd NW
- 4140 Hardscrabble Rd
- 304 Middleburn St
- 316 Bottecchia Blvd
- 7982 Duncan Plains Rd
- 7982 Duncan Plains Rd NW
- 7988 Duncan Plains Rd NW
- 7952 Duncan Plains Rd
- 7988 Duncan Plains Rd
- 8001 Duncan Plains Rd NW
- 8001 Duncan Plains Rd
- 3543 Johnstown Alexandria Rd
- 8028 Duncan Plains Rd NW
- 8028 Duncan Plains Rd
- 7898 Duncan Plains Rd
- 3581 Johnstown Alexandria Rd
- 7870 Duncan Plains Rd
- 8048 Duncan Plains Rd NW
- 8048 Duncan Plains Rd
- 3500 Johnstown Alexandria Rd
- 3522 Johnstown Alexandria Rd
- 7951 Duncan Plains Rd
- 8080 Duncan Plains Rd
- 8080 Duncan Plains Rd