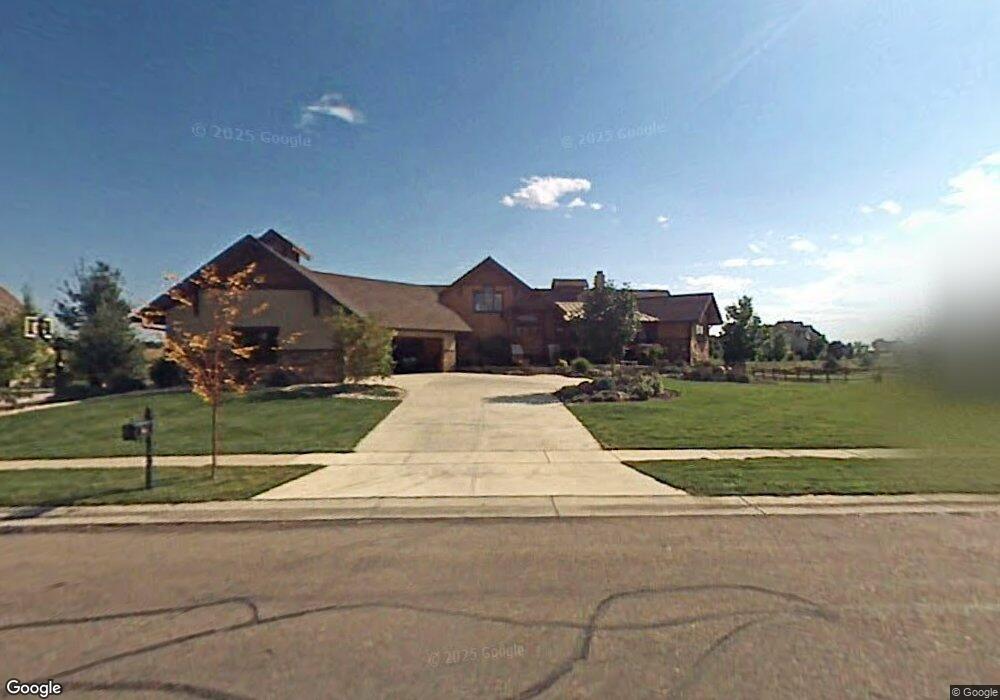
7988 Eagle Ranch Rd Fort Collins, CO 80528
Estimated Value: $1,517,000 - $1,897,000
5
Beds
7
Baths
5,326
Sq Ft
$322/Sq Ft
Est. Value
About This Home
This home is located at 7988 Eagle Ranch Rd, Fort Collins, CO 80528 and is currently estimated at $1,716,431, approximately $322 per square foot. 7988 Eagle Ranch Rd is a home located in Larimer County with nearby schools including Preston Middle School, Fossil Ridge High School, and Colorado Early Colleges Windsor.
Ownership History
Date
Name
Owned For
Owner Type
Purchase Details
Closed on
Dec 27, 2005
Sold by
Archer Homes Inc
Bought by
Wood John L and Wood Jill E
Current Estimated Value
Home Financials for this Owner
Home Financials are based on the most recent Mortgage that was taken out on this home.
Original Mortgage
$400,000
Outstanding Balance
$224,298
Interest Rate
6.23%
Mortgage Type
New Conventional
Estimated Equity
$1,492,133
Purchase Details
Closed on
Aug 29, 2000
Sold by
Thompson Patricia J
Bought by
Archer Homes Inc
Home Financials for this Owner
Home Financials are based on the most recent Mortgage that was taken out on this home.
Original Mortgage
$80,000
Interest Rate
8.21%
Purchase Details
Closed on
Jun 25, 1998
Sold by
Three Eagles Development Llc
Bought by
Thompson Patricia J
Home Financials for this Owner
Home Financials are based on the most recent Mortgage that was taken out on this home.
Original Mortgage
$58,934
Interest Rate
7.13%
Mortgage Type
Unknown
Create a Home Valuation Report for This Property
The Home Valuation Report is an in-depth analysis detailing your home's value as well as a comparison with similar homes in the area
Purchase History
| Date | Buyer | Sale Price | Title Company |
|---|---|---|---|
| Wood John L | $1,060,000 | -- | |
| Archer Homes Inc | $100,000 | Stewart Title | |
| Thompson Patricia J | $72,750 | Stewart Title |
Source: Public Records
Mortgage History
| Date | Status | Borrower | Loan Amount |
|---|---|---|---|
| Open | Wood John L | $400,000 | |
| Previous Owner | Archer Homes Inc | $80,000 | |
| Previous Owner | Thompson Patricia J | $58,934 |
Source: Public Records
Tax History
| Year | Tax Paid | Tax Assessment Tax Assessment Total Assessment is a certain percentage of the fair market value that is determined by local assessors to be the total taxable value of land and additions on the property. | Land | Improvement |
|---|---|---|---|---|
| 2025 | $12,003 | $99,994 | $18,438 | $81,556 |
| 2024 | $11,496 | $113,686 | $19,765 | $93,921 |
| 2022 | $9,104 | $84,617 | $15,221 | $69,396 |
| 2021 | $9,205 | $87,052 | $15,659 | $71,393 |
| 2020 | $8,176 | $76,727 | $9,295 | $67,432 |
| 2019 | $8,206 | $76,727 | $9,295 | $67,432 |
| 2018 | $8,258 | $79,344 | $9,360 | $69,984 |
| 2017 | $8,234 | $79,344 | $9,360 | $69,984 |
| 2016 | $8,298 | $79,608 | $10,348 | $69,260 |
| 2015 | $8,244 | $79,610 | $10,350 | $69,260 |
| 2014 | $8,448 | $81,110 | $8,760 | $72,350 |
Source: Public Records
Map
Nearby Homes
- 7848 Eagle Ranch Rd
- 8228 Three Eagles Dr
- 8120 Otis Ct
- 0 Colorado 392
- 8120 Mummy Range Dr
- 8508 Audubon Ct
- 8420 SE Frontage Rd
- 8420 SE Frontage Rd S
- 0 Royal Vista Cir Unit RECIR1019271
- 8113 Louden Crossing
- 8493 Annapolis Dr
- 5815 Rockwell Ave
- 8119 Lighthouse Ln
- 8135 Lighthouse Ln
- 5483 Shadow Creek Ct
- 5642 Shadow Creek Ct
- 8443 Castaway Dr
- 5328 Moonlight Bay Dr
- 5881 Bay Hill Ct
- 5818 Lockheed Ave
- 7994 Eagle Ranch Rd
- 7982 Eagle Ranch Rd
- 7989 Eagle Ranch Rd
- 7985 Eagle Ranch Rd
- 7976 Eagle Ranch Rd
- 7860 Eagle Ranch Rd
- 7860 Eagle Ranch Rd
- 7971 Eagle Ranch Rd
- 8102 Three Eagles Dr
- 7970 Eagle Ranch Rd
- 8110 Three Eagles Dr
- 7856 Eagle Ranch Rd
- 7856 Eagle Ranch Rd
- 7857 Eagle Ranch Rd
- 7963 Eagle Ranch Rd
- 8103 Golden Eagle Rd
- 8118 Three Eagles Dr
- 7964 Eagle Ranch Rd
- 7851 Eagle Ranch Rd
- 7959 Eagle Ranch Rd
Your Personal Tour Guide
Ask me questions while you tour the home.