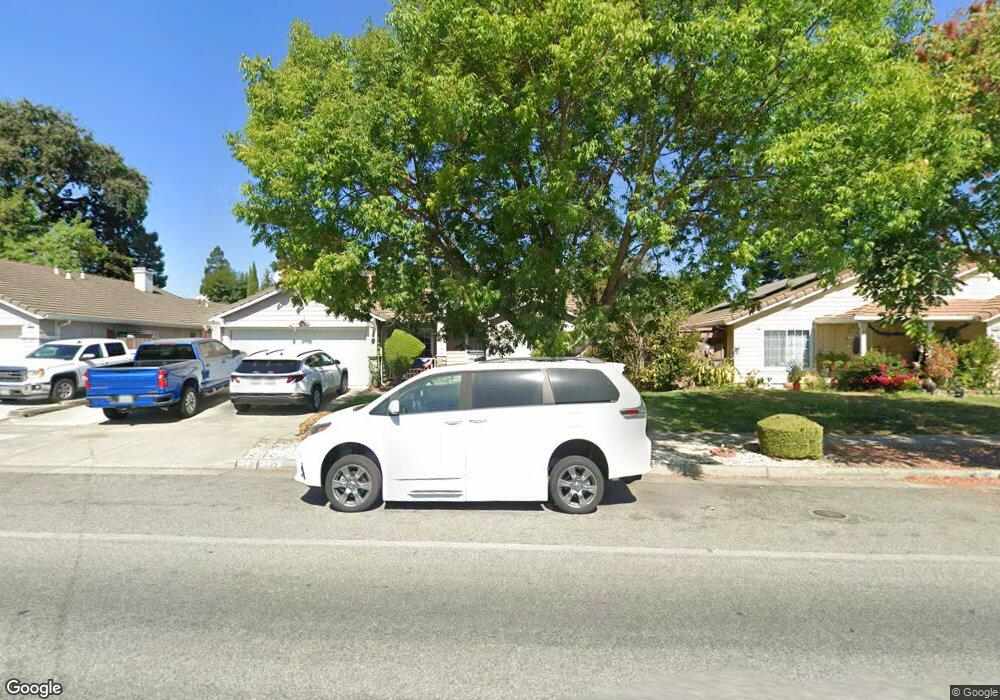
799 Mantelli Dr Gilroy, CA 95020
Las Animas NeighborhoodEstimated Value: $951,000 - $1,006,000
4
Beds
2
Baths
1,879
Sq Ft
$522/Sq Ft
Est. Value
About This Home
This home is located at 799 Mantelli Dr, Gilroy, CA 95020 and is currently estimated at $980,523, approximately $521 per square foot. 799 Mantelli Dr is a home located in Santa Clara County with nearby schools including South Valley Middle School, Solorsano Middle School, and Christopher High School.
Ownership History
Date
Name
Owned For
Owner Type
Purchase Details
Closed on
Aug 3, 2017
Sold by
Heflin Michael L and Heflin Edith M
Bought by
Heflin Michael L and Heflin Edith M
Current Estimated Value
Home Financials for this Owner
Home Financials are based on the most recent Mortgage that was taken out on this home.
Original Mortgage
$438,000
Interest Rate
3.9%
Mortgage Type
VA
Purchase Details
Closed on
Oct 10, 2008
Sold by
Heflin Michael L and Heflin Edith M
Bought by
Heflin Michael L and Heflin Edith M
Purchase Details
Closed on
May 22, 2001
Sold by
Heflin Mike L and Heflin Edith M
Bought by
Heflin Mike L and Heflin Edith M
Home Financials for this Owner
Home Financials are based on the most recent Mortgage that was taken out on this home.
Original Mortgage
$300,000
Interest Rate
7.15%
Purchase Details
Closed on
Jul 29, 1998
Sold by
Neflin Michael Lloyd
Bought by
Neflin Michael Lloyd and Neflin Edith Marie
Create a Home Valuation Report for This Property
The Home Valuation Report is an in-depth analysis detailing your home's value as well as a comparison with similar homes in the area
Home Values in the Area
Average Home Value in this Area
Purchase History
| Date | Buyer | Sale Price | Title Company |
|---|---|---|---|
| Heflin Michael L | -- | Western Resources Title | |
| Heflin Michael L | -- | Western Resources Title | |
| Heflin Michael L | -- | None Available | |
| Heflin Mike L | -- | Chicago Title Co | |
| Neflin Michael Lloyd | -- | -- |
Source: Public Records
Mortgage History
| Date | Status | Borrower | Loan Amount |
|---|---|---|---|
| Closed | Heflin Michael L | $438,000 | |
| Closed | Heflin Mike L | $300,000 |
Source: Public Records
Tax History Compared to Growth
Tax History
| Year | Tax Paid | Tax Assessment Tax Assessment Total Assessment is a certain percentage of the fair market value that is determined by local assessors to be the total taxable value of land and additions on the property. | Land | Improvement |
|---|---|---|---|---|
| 2025 | $6,103 | $389,538 | $99,659 | $289,879 |
| 2024 | $6,103 | $381,901 | $97,705 | $284,196 |
| 2023 | $6,152 | $374,414 | $95,790 | $278,624 |
| 2022 | $6,204 | $367,073 | $93,912 | $273,161 |
| 2021 | $6,184 | $359,876 | $92,071 | $267,805 |
| 2020 | $6,186 | $356,186 | $91,127 | $265,059 |
| 2019 | $6,162 | $349,203 | $89,341 | $259,862 |
| 2018 | $6,005 | $342,357 | $87,590 | $254,767 |
| 2017 | $2,725 | $335,645 | $85,873 | $249,772 |
| 2016 | $2,676 | $329,065 | $84,190 | $244,875 |
| 2015 | $2,515 | $324,123 | $82,926 | $241,197 |
| 2014 | $2,487 | $317,775 | $81,302 | $236,473 |
Source: Public Records
Map
Nearby Homes
- 670 Wickham Ct
- 796 Gary St
- 820 Woodcreek Way
- 100 Block Ronan Ave
- 9135 Desiderio Way
- 722 Carver Place
- 201 Ronan Ave
- 190 Ronan Ave
- 714 Sullivan Way
- 958 Bosco Ln Unit 1603
- 1206 Sycamore Ct
- 119 Farrell Ave
- 103 Farrell Ave
- 111 Farrell Ave
- 232 Loupe Ct
- 780 Welburn Ave
- 1297 Chesbro Way
- 751 La Paloma Way
- 8190 Westwood Dr
- 8420 David Ct
- 793 Mantelli Dr
- 805 Mantelli Dr
- 9085 Spencer Ct
- 789 Mantelli Dr
- 9075 Spencer Ct
- 9095 Spencer Ct
- 9065 Spencer Ct
- 8751 Amanda Ave
- 9055 Spencer Ct
- 796 Mantelli Dr
- 9098 Spencer Ct
- 806 Mantelli Dr
- 9015 Spencer Ct
- 9025 Spencer Ct
- 794 Mantelli Dr
- 9035 Spencer Ct
- 801 Ramona Way
- 807 Ramona Way
- 9045 Spencer Ct
- 799 Ramona Way