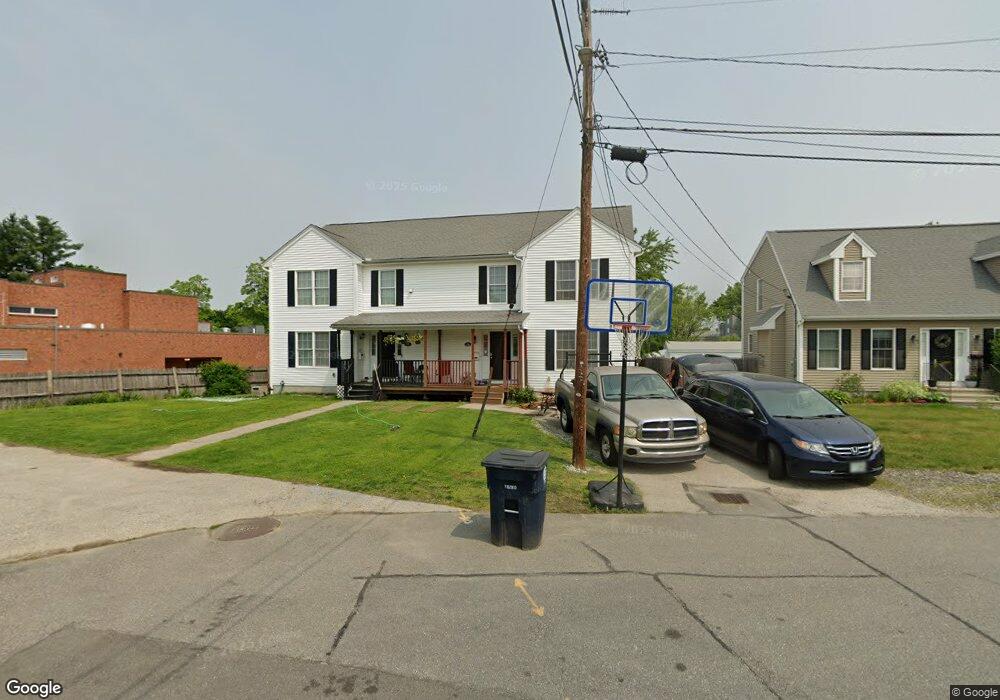
7B Acton St Unit B Nashua, NH 03060
South End Nashua NeighborhoodEstimated Value: $359,000 - $458,000
3
Beds
1
Bath
1,408
Sq Ft
$302/Sq Ft
Est. Value
About This Home
This home is located at 7B Acton St Unit B, Nashua, NH 03060 and is currently estimated at $425,565, approximately $302 per square foot. 7B Acton St Unit B is a home located in Hillsborough County with nearby schools including Fairgrounds Elementary School, Fairgrounds Middle School, and Nashua High School South.
Ownership History
Date
Name
Owned For
Owner Type
Purchase Details
Closed on
Oct 11, 2023
Sold by
Williams Oral and Williams Jaime
Bought by
Williams
Current Estimated Value
Purchase Details
Closed on
Jan 11, 2007
Sold by
Ur Home Building & Dev L
Bought by
Williams Oral
Home Financials for this Owner
Home Financials are based on the most recent Mortgage that was taken out on this home.
Original Mortgage
$225,910
Interest Rate
6.18%
Mortgage Type
Purchase Money Mortgage
Create a Home Valuation Report for This Property
The Home Valuation Report is an in-depth analysis detailing your home's value as well as a comparison with similar homes in the area
Home Values in the Area
Average Home Value in this Area
Purchase History
| Date | Buyer | Sale Price | Title Company |
|---|---|---|---|
| Williams | -- | None Available | |
| Williams Oral | $225,000 | -- |
Source: Public Records
Mortgage History
| Date | Status | Borrower | Loan Amount |
|---|---|---|---|
| Previous Owner | Williams Oral | $225,910 |
Source: Public Records
Tax History Compared to Growth
Tax History
| Year | Tax Paid | Tax Assessment Tax Assessment Total Assessment is a certain percentage of the fair market value that is determined by local assessors to be the total taxable value of land and additions on the property. | Land | Improvement |
|---|---|---|---|---|
| 2024 | $5,942 | $373,700 | $0 | $373,700 |
| 2023 | $6,340 | $347,800 | $0 | $347,800 |
| 2022 | $6,285 | $347,800 | $0 | $347,800 |
| 2021 | $4,755 | $204,800 | $0 | $204,800 |
| 2020 | $4,631 | $204,800 | $0 | $204,800 |
| 2019 | $4,456 | $204,800 | $0 | $204,800 |
| 2018 | $4,344 | $204,800 | $0 | $204,800 |
| 2017 | $4,544 | $176,200 | $0 | $176,200 |
| 2016 | $4,417 | $176,200 | $0 | $176,200 |
| 2015 | $4,322 | $176,200 | $0 | $176,200 |
| 2014 | $4,238 | $176,200 | $0 | $176,200 |
Source: Public Records
Map
Nearby Homes
- 30 Dexter St Unit 106
- 70 Linwood St
- 19.5 Balcom St
- 15 Lovell St Unit 20
- 15 Lovell St Unit 3
- 15 Lovell St Unit 10
- 6 Lake Ave
- 121 Palm St
- 10 Zellwood St
- 29 Wilder St
- 4 Badger St
- 8 Buck St Unit 10
- 1 Hayden St
- 71 Vine St Unit 713/4
- 1 Circle Ave
- 13 Wason Ave Unit 29
- 169A W Hollis St Unit 193
- 22 Kern Dr
- 15 Learned St Unit 123
- 2 Fox Meadow Rd