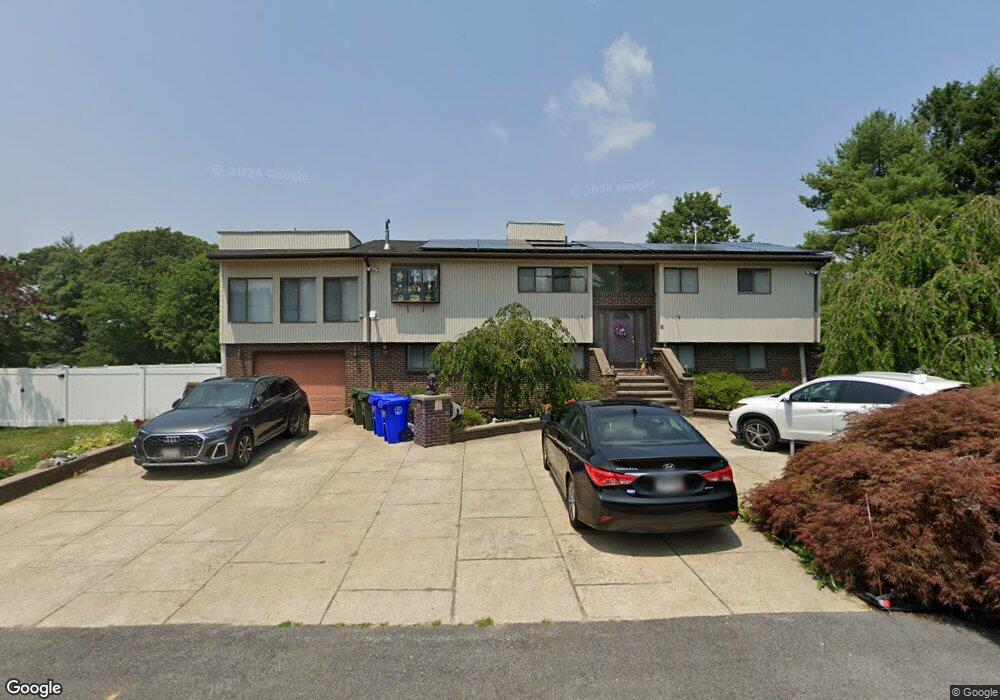
8 Albion St Bristol, RI 02809
Downtown Bristol NeighborhoodEstimated Value: $615,000 - $732,000
2
Beds
3
Baths
2,756
Sq Ft
$245/Sq Ft
Est. Value
About This Home
This home is located at 8 Albion St, Bristol, RI 02809 and is currently estimated at $675,170, approximately $244 per square foot. 8 Albion St is a home located in Bristol County with nearby schools including Mt. Hope High School and Our Lady of Mt. Carmel School.
Ownership History
Date
Name
Owned For
Owner Type
Purchase Details
Closed on
Nov 19, 2021
Sold by
Dacosta Catelynn
Bought by
Rosa Joseph F and Rosa Paula E
Current Estimated Value
Home Financials for this Owner
Home Financials are based on the most recent Mortgage that was taken out on this home.
Original Mortgage
$28,000
Outstanding Balance
$25,479
Interest Rate
3.09%
Mortgage Type
New Conventional
Estimated Equity
$649,691
Purchase Details
Closed on
Nov 12, 2021
Sold by
Rosa Joseph F and Rosa Paula E
Bought by
Dacosta Catelynn
Home Financials for this Owner
Home Financials are based on the most recent Mortgage that was taken out on this home.
Original Mortgage
$28,000
Outstanding Balance
$25,479
Interest Rate
3.09%
Mortgage Type
New Conventional
Estimated Equity
$649,691
Create a Home Valuation Report for This Property
The Home Valuation Report is an in-depth analysis detailing your home's value as well as a comparison with similar homes in the area
Home Values in the Area
Average Home Value in this Area
Purchase History
| Date | Buyer | Sale Price | Title Company |
|---|---|---|---|
| Rosa Joseph F | -- | None Available | |
| Dacosta Catelynn | $420,000 | None Available |
Source: Public Records
Mortgage History
| Date | Status | Borrower | Loan Amount |
|---|---|---|---|
| Open | Rosa Joseph F | $28,000 | |
| Open | Dacosta Catelynn | $336,000 |
Source: Public Records
Tax History
| Year | Tax Paid | Tax Assessment Tax Assessment Total Assessment is a certain percentage of the fair market value that is determined by local assessors to be the total taxable value of land and additions on the property. | Land | Improvement |
|---|---|---|---|---|
| 2025 | $5,836 | $422,300 | $169,900 | $252,400 |
| 2024 | $5,836 | $422,300 | $169,900 | $252,400 |
| 2023 | $5,642 | $422,300 | $169,900 | $252,400 |
| 2022 | $5,490 | $422,300 | $169,900 | $252,400 |
| 2021 | $4,964 | $345,200 | $151,500 | $193,700 |
| 2020 | $4,857 | $345,200 | $151,500 | $193,700 |
| 2019 | $5,104 | $372,000 | $151,500 | $220,500 |
| 2018 | $4,416 | $287,100 | $116,800 | $170,300 |
| 2017 | $3,702 | $248,100 | $96,200 | $151,900 |
| 2016 | $3,664 | $248,100 | $96,200 | $151,900 |
| 2015 | $3,481 | $248,100 | $96,200 | $151,900 |
| 2014 | $4,071 | $311,730 | $139,300 | $172,430 |
Source: Public Records
Map
Nearby Homes
- 88 Burton St
- 236 State St
- 9 Hope St
- 32 Massasoit Ave
- 30 Massasoit Ave
- 25 Massasoit Ave
- 27 Massasoit Ave
- 2 Chilton St
- 221 Hope St Unit 2
- 2 Wilson St
- 78 State St
- 423 Hope St Unit 1A
- 15 Bourne St
- 18 State St Unit 5 (3rd Floor East)
- 21 Monroe Ave
- 44 Bradford St Unit 49
- 85 Bay View Ave Unit 3
- 85 Bay View Ave Unit 2
- 413 High St
- 79 Hopeworth Ave
Your Personal Tour Guide
Ask me questions while you tour the home.