8 Cactus Rd Edgewood, NM 87015
Estimated Value: $298,000 - $394,000
3
Beds
2
Baths
2,279
Sq Ft
$154/Sq Ft
Est. Value
About This Home
This home is located at 8 Cactus Rd, Edgewood, NM 87015 and is currently estimated at $350,820, approximately $153 per square foot. 8 Cactus Rd is a home located in Santa Fe County with nearby schools including Route 66 Elementary School, Edgewood Middle School, and Moriarty High School.
Ownership History
Date
Name
Owned For
Owner Type
Purchase Details
Closed on
Feb 7, 2012
Sold by
Ammerman Matthew V and Ammerman Lauren P
Bought by
Ammerman Matthew V and Ammerman Lauren P
Current Estimated Value
Home Financials for this Owner
Home Financials are based on the most recent Mortgage that was taken out on this home.
Original Mortgage
$125,000
Interest Rate
3.95%
Mortgage Type
New Conventional
Purchase Details
Closed on
Jun 1, 2007
Sold by
Federal National Mortgage Association
Bought by
Ammerman Matthew V and Ammerman Lauren P
Purchase Details
Closed on
May 16, 2007
Sold by
Countrywide Home Loans Inc
Bought by
Federal National Mortgage Association
Purchase Details
Closed on
Apr 27, 2007
Sold by
Countrywide Home Loans Inc
Bought by
Federal National Mortgage Association
Create a Home Valuation Report for This Property
The Home Valuation Report is an in-depth analysis detailing your home's value as well as a comparison with similar homes in the area
Home Values in the Area
Average Home Value in this Area
Purchase History
| Date | Buyer | Sale Price | Title Company |
|---|---|---|---|
| Ammerman Matthew V | -- | Accommodation | |
| Ammerman Matthew V | -- | Rio Grande Title Company Inc | |
| Federal National Mortgage Association | -- | None Available | |
| Federal National Mortgage Association | -- | Rio Grande Title Company Inc |
Source: Public Records
Mortgage History
| Date | Status | Borrower | Loan Amount |
|---|---|---|---|
| Closed | Ammerman Matthew V | $125,000 |
Source: Public Records
Tax History
| Year | Tax Paid | Tax Assessment Tax Assessment Total Assessment is a certain percentage of the fair market value that is determined by local assessors to be the total taxable value of land and additions on the property. | Land | Improvement |
|---|---|---|---|---|
| 2025 | $1,223 | $158,555 | $28,250 | $130,305 |
| 2024 | $1,241 | $153,938 | $29,262 | $124,676 |
| 2023 | $1,214 | $149,455 | $28,410 | $121,045 |
| 2022 | $1,188 | $145,103 | $27,583 | $117,520 |
| 2021 | $1,158 | $46,959 | $8,926 | $38,033 |
| 2020 | $1,132 | $45,592 | $8,666 | $36,926 |
| 2019 | $1,113 | $44,264 | $8,666 | $35,598 |
| 2018 | $1,080 | $42,975 | $8,666 | $34,309 |
| 2017 | $1,030 | $41,723 | $8,666 | $33,057 |
| 2016 | $911 | $40,509 | $8,667 | $31,842 |
| 2015 | $910 | $39,329 | $8,667 | $30,662 |
| 2014 | $898 | $38,145 | $8,658 | $29,487 |
Source: Public Records
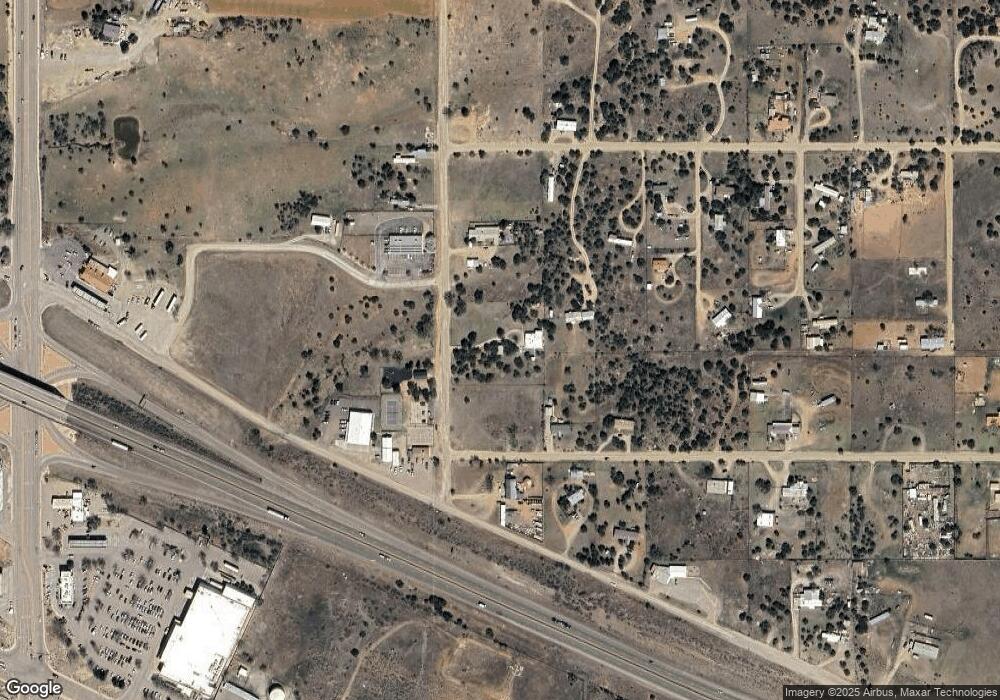
Map
Nearby Homes
- 10 Liberty Square Cir
- 16 Wildwood Way
- 8 Capital Rd
- 13 E Willard Rd
- 0 Walker Rd
- 12 Edgewood 7
- 1 Taluca Ct
- 16 Neighborly Way
- 19 Neighborly Way
- 109 Church St E
- 26 W Willard Rd
- 3 Linnie Ct
- 0 Edgewood 7
- 0 Edgewood Rd Unit 202505123
- 100 Meadows Ln
- 0 Unassigned Unit 1096209
- 11 Cunningham
- 18 Buck Rd
- 2063 Old Us 66
- 10 Mustang Rd
Your Personal Tour Guide
Ask me questions while you tour the home.