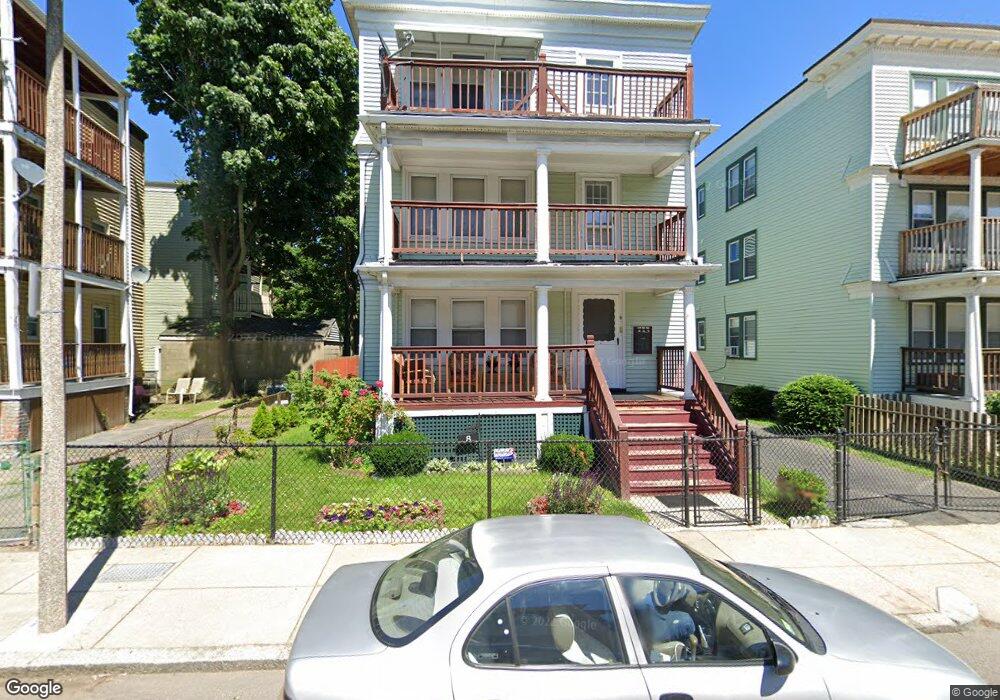
8 Chipman St Dorchester Center, MA 02124
Codman Square NeighborhoodEstimated Value: $1,029,000 - $1,149,000
6
Beds
3
Baths
3,300
Sq Ft
$333/Sq Ft
Est. Value
About This Home
This home is located at 8 Chipman St, Dorchester Center, MA 02124 and is currently estimated at $1,097,667, approximately $332 per square foot. 8 Chipman St is a home located in Suffolk County with nearby schools including Codman Academy Charter Public School.
Ownership History
Date
Name
Owned For
Owner Type
Purchase Details
Closed on
May 7, 2021
Sold by
Wilson Elnora
Bought by
Wilson Elnora and Rhodes Columbus
Current Estimated Value
Purchase Details
Closed on
Nov 21, 1994
Sold by
Marable Ora A Est
Bought by
Wilson Elnora
Home Financials for this Owner
Home Financials are based on the most recent Mortgage that was taken out on this home.
Original Mortgage
$95,000
Interest Rate
8.9%
Mortgage Type
Purchase Money Mortgage
Create a Home Valuation Report for This Property
The Home Valuation Report is an in-depth analysis detailing your home's value as well as a comparison with similar homes in the area
Home Values in the Area
Average Home Value in this Area
Purchase History
| Date | Buyer | Sale Price | Title Company |
|---|---|---|---|
| Wilson Elnora | -- | None Available | |
| Wilson Elnora | $100,000 | -- |
Source: Public Records
Mortgage History
| Date | Status | Borrower | Loan Amount |
|---|---|---|---|
| Previous Owner | Wilson Elnora | $95,000 |
Source: Public Records
Tax History Compared to Growth
Tax History
| Year | Tax Paid | Tax Assessment Tax Assessment Total Assessment is a certain percentage of the fair market value that is determined by local assessors to be the total taxable value of land and additions on the property. | Land | Improvement |
|---|---|---|---|---|
| 2025 | $10,100 | $872,200 | $253,700 | $618,500 |
| 2024 | $9,303 | $853,500 | $226,500 | $627,000 |
| 2023 | $8,486 | $790,100 | $209,700 | $580,400 |
| 2022 | $7,678 | $705,700 | $187,300 | $518,400 |
| 2021 | $7,037 | $659,500 | $175,000 | $484,500 |
| 2020 | $5,922 | $560,800 | $185,300 | $375,500 |
| 2019 | $5,367 | $509,200 | $144,800 | $364,400 |
| 2018 | $4,852 | $463,000 | $144,800 | $318,200 |
| 2017 | $4,856 | $458,500 | $144,800 | $313,700 |
| 2016 | $4,463 | $405,700 | $144,800 | $260,900 |
| 2015 | $4,240 | $350,100 | $128,500 | $221,600 |
| 2014 | $3,933 | $312,600 | $128,500 | $184,100 |
Source: Public Records
Map
Nearby Homes
- 43 Withington St Unit 7
- 52 Withington St Unit 7
- 39 Torrey St Unit 1
- 31 Chipman St
- 29 Torrey St
- 39 Chipman St
- 19 Elmhurst St
- 141 Norfolk St
- 26 Harley St Unit 1
- 27 Armandine St Unit 1
- 23 Dunlap St
- 47 Roslin St Unit 1
- 438 Talbot Ave
- 61 Lyndhurst St Unit A
- 92 Spencer St
- 74 Burt St Unit 303
- 74 Burt St Unit 201
- 123-125 Centre St Unit TH 6
- 123-125 Centre St Unit TH4
- 8 Oakhurst St Unit 4
- 12 Chipman St
- 66 Norfolk St Unit 2
- 66 Norfolk St
- 66 Norfolk St Unit 3
- 66 Norfolk St Unit 1
- 68 Norfolk St Unit 3
- 68 Norfolk St Unit 2
- 68 Norfolk St Unit 1
- 68 Norfolk St
- 16 Chipman St
- 7 Oakwood St
- 64 Norfolk St
- 11 Oakwood St
- 11 Oakwood St
- 7 Chipman St
- 15 Oakwood St
- 20 Chipman St
- 9 Chipman St
- 60 Norfolk St
- 19 Oakwood St