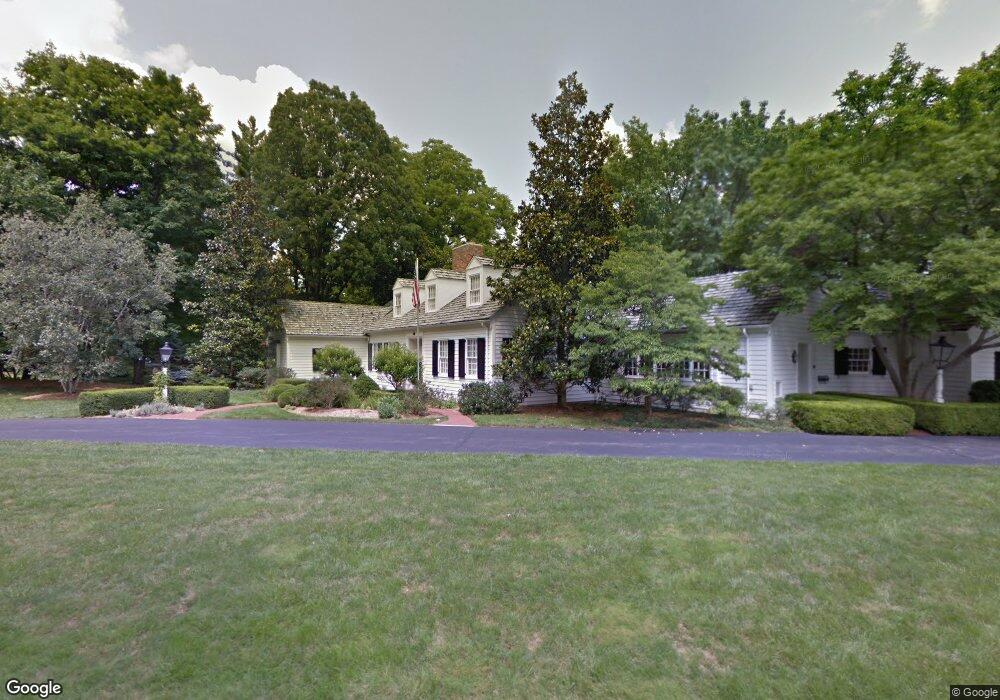
8 Corbin Dr Cincinnati, OH 45208
Hyde Park NeighborhoodEstimated Value: $1,705,520 - $1,806,000
3
Beds
6
Baths
4,216
Sq Ft
$416/Sq Ft
Est. Value
About This Home
This home is located at 8 Corbin Dr, Cincinnati, OH 45208 and is currently estimated at $1,755,173, approximately $416 per square foot. 8 Corbin Dr is a home located in Hamilton County with nearby schools including Withrow University High School, Clark Montessori High School, and Shroder High School.
Ownership History
Date
Name
Owned For
Owner Type
Purchase Details
Closed on
Jun 2, 2016
Sold by
Tew Susan Smyth
Bought by
Edmiston Robert G and Edmiston Pamela B
Current Estimated Value
Home Financials for this Owner
Home Financials are based on the most recent Mortgage that was taken out on this home.
Original Mortgage
$1,120,000
Outstanding Balance
$884,344
Interest Rate
3.66%
Mortgage Type
New Conventional
Estimated Equity
$870,829
Purchase Details
Closed on
Aug 12, 2003
Sold by
Tew Susan S and Tew John M
Bought by
Tew Susan Smyth and Tew John M
Purchase Details
Closed on
Sep 5, 1997
Sold by
Antell Barbara Brigham
Bought by
Tew Susan S
Home Financials for this Owner
Home Financials are based on the most recent Mortgage that was taken out on this home.
Original Mortgage
$650,000
Interest Rate
7.44%
Create a Home Valuation Report for This Property
The Home Valuation Report is an in-depth analysis detailing your home's value as well as a comparison with similar homes in the area
Home Values in the Area
Average Home Value in this Area
Purchase History
| Date | Buyer | Sale Price | Title Company |
|---|---|---|---|
| Edmiston Robert G | $1,400,000 | -- | |
| Tew Susan Smyth | -- | -- | |
| Tew Susan S | -- | -- | |
| Antell Barbara Brigham | $1,100,000 | -- | |
| Kohnen Monica Donath | -- | -- |
Source: Public Records
Mortgage History
| Date | Status | Borrower | Loan Amount |
|---|---|---|---|
| Open | Edmiston Robert G | $1,120,000 | |
| Previous Owner | Tew Susan S | $650,000 |
Source: Public Records
Tax History
| Year | Tax Paid | Tax Assessment Tax Assessment Total Assessment is a certain percentage of the fair market value that is determined by local assessors to be the total taxable value of land and additions on the property. | Land | Improvement |
|---|---|---|---|---|
| 2025 | $33,190 | $538,766 | $220,602 | $318,164 |
| 2024 | $32,270 | $538,766 | $220,602 | $318,164 |
| 2023 | $32,936 | $538,766 | $220,602 | $318,164 |
| 2022 | $34,961 | $513,706 | $146,395 | $367,311 |
| 2021 | $33,716 | $513,706 | $146,395 | $367,311 |
| 2020 | $34,651 | $513,706 | $146,395 | $367,311 |
| 2019 | $36,087 | $489,245 | $139,423 | $349,822 |
| 2018 | $36,141 | $489,245 | $139,423 | $349,822 |
| 2017 | $34,368 | $489,245 | $139,423 | $349,822 |
| 2016 | $26,927 | $386,425 | $132,363 | $254,062 |
| 2015 | $24,261 | $386,425 | $132,363 | $254,062 |
| 2014 | $24,432 | $386,425 | $132,363 | $254,062 |
| 2013 | $22,759 | $354,516 | $121,433 | $233,083 |
Source: Public Records
Map
Nearby Homes
- 2833 Grandin Hollow Ln
- 2851 Hoff Ave
- 2828 Hoff Ave
- 312 Audubon St
- 2764 Hoff Ave
- 2734 Hoff Ave
- 3021 Riverside Dr
- 3219 Riverside Dr
- 1121 Edwards Rd
- 3108 Walworth Ave
- 2939 Walworth Ave
- 3120 Walworth Ave
- 3104 Walworth Ave
- 3096 Walworth Ave
- 18 Elmhurst Place
- 416 Torrence Ct
- 260 Watson St
- 2485 Riverside Dr
- 3304 Columbia Pkwy
- 271 Strader Ave
- 7 Corbin Dr
- 2341 Corbin Dr
- 9 Corbin Dr
- 10 Corbin Dr
- 5 Corbin Dr
- 2808 Grandin Hollow Ln
- 2415 Grandin Gate Ln
- 2820 Grandin Hollow Ln
- 30 Weebetook Ln
- 11 Corbin Dr
- 28 Weebetook Ln
- 2409 Grandin Rd
- 2420 Grandin Gate Ln
- 2842 Grandin Hollow Ln
- 24 Weebetook Ln
- 35 Weebetook Ln
- 14 Corbin Dr
- 2805 Ambleside Place
- 20 Weebetook Ln
- 2813 Ambleside Place
Your Personal Tour Guide
Ask me questions while you tour the home.