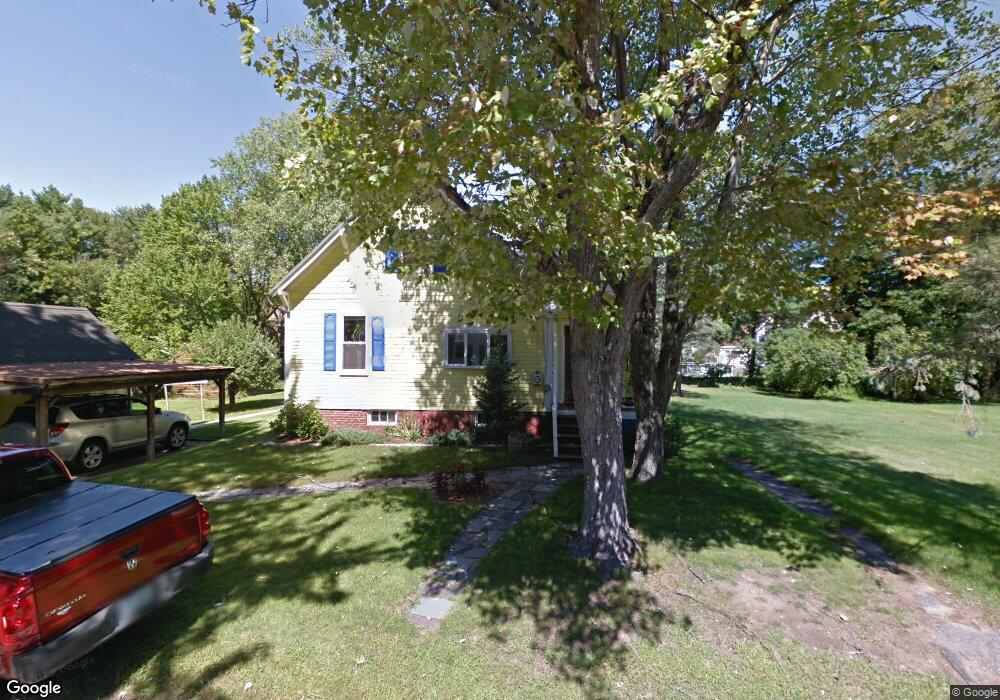
8 Cote St Concord, NH 03301
South End NeighborhoodEstimated Value: $476,633 - $514,000
4
Beds
2
Baths
1,929
Sq Ft
$255/Sq Ft
Est. Value
About This Home
This home is located at 8 Cote St, Concord, NH 03301 and is currently estimated at $491,408, approximately $254 per square foot. 8 Cote St is a home located in Merrimack County with nearby schools including Abbot-Downing School, Rundlett Middle School, and Concord High School.
Ownership History
Date
Name
Owned For
Owner Type
Purchase Details
Closed on
Jul 14, 2000
Sold by
Maze David M and Maze Theresa M
Bought by
Keller David B and Keller Lindy Sue
Current Estimated Value
Home Financials for this Owner
Home Financials are based on the most recent Mortgage that was taken out on this home.
Original Mortgage
$145,000
Outstanding Balance
$49,884
Interest Rate
8.5%
Mortgage Type
Purchase Money Mortgage
Estimated Equity
$441,524
Create a Home Valuation Report for This Property
The Home Valuation Report is an in-depth analysis detailing your home's value as well as a comparison with similar homes in the area
Home Values in the Area
Average Home Value in this Area
Purchase History
| Date | Buyer | Sale Price | Title Company |
|---|---|---|---|
| Keller David B | $161,400 | -- |
Source: Public Records
Mortgage History
| Date | Status | Borrower | Loan Amount |
|---|---|---|---|
| Open | Keller David B | $70,000 | |
| Open | Keller David B | $145,000 |
Source: Public Records
Tax History
| Year | Tax Paid | Tax Assessment Tax Assessment Total Assessment is a certain percentage of the fair market value that is determined by local assessors to be the total taxable value of land and additions on the property. | Land | Improvement |
|---|---|---|---|---|
| 2025 | $8,224 | $282,500 | $111,400 | $171,100 |
| 2024 | $7,822 | $282,500 | $111,400 | $171,100 |
| 2023 | $7,545 | $280,900 | $111,400 | $169,500 |
| 2022 | $7,187 | $277,600 | $111,400 | $166,200 |
| 2021 | $6,941 | $276,300 | $111,400 | $164,900 |
| 2020 | $6,813 | $254,600 | $93,100 | $161,500 |
| 2019 | $6,528 | $235,000 | $91,700 | $143,300 |
| 2018 | $1,414 | $215,500 | $87,900 | $127,600 |
| 2017 | $5,888 | $208,500 | $86,300 | $122,200 |
| 2016 | $5,517 | $199,400 | $86,300 | $113,100 |
| 2015 | $5,318 | $190,600 | $78,500 | $112,100 |
| 2014 | $5,110 | $190,600 | $78,500 | $112,100 |
| 2013 | -- | $187,500 | $78,500 | $109,000 |
| 2012 | -- | $189,200 | $78,500 | $110,700 |
Source: Public Records
Map
Nearby Homes
- 33 Joffre St
- 335 S Main St
- 40 Nivelle St
- 0 South St Unit 4969509
- 289 South St
- 273-279 S Main St
- 30 Longmeadow Dr
- 47 Noyes St
- 47 South St
- 111 -113 South Main St
- 58 S State St
- 7-9 Myrtle St
- 21 Fairfield Dr
- 22 Fairfield Dr
- 20 Fairfield Dr
- 5 Holly Cir
- 5 Windchime Dr
- 25 N Spring St
- 26 Jonathan Ln
- 4 Bow Center Rd Unit F2
Your Personal Tour Guide
Ask me questions while you tour the home.