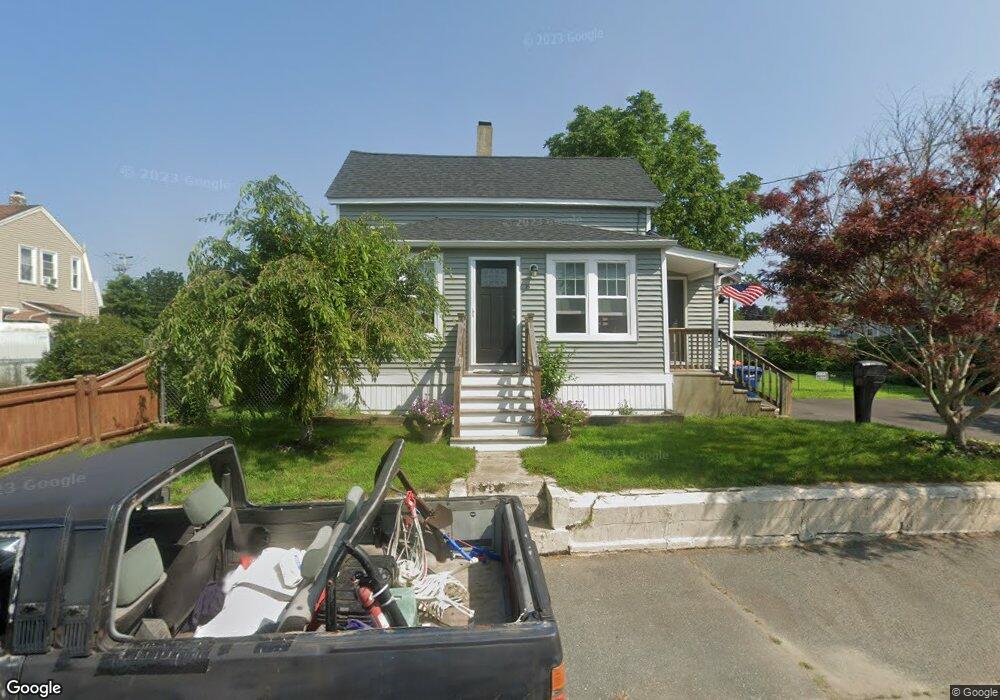
8 Daniel St Fairhaven, MA 02719
North Fairhaven NeighborhoodEstimated Value: $497,090 - $632,000
3
Beds
2
Baths
1,466
Sq Ft
$367/Sq Ft
Est. Value
About This Home
This home is located at 8 Daniel St, Fairhaven, MA 02719 and is currently estimated at $538,523, approximately $367 per square foot. 8 Daniel St is a home located in Bristol County with nearby schools including Fairhaven High School, Alma Del Mar Charter School, and St. Joseph School.
Ownership History
Date
Name
Owned For
Owner Type
Purchase Details
Closed on
May 17, 2021
Sold by
Smc Llc
Bought by
Santos Susan J
Current Estimated Value
Home Financials for this Owner
Home Financials are based on the most recent Mortgage that was taken out on this home.
Original Mortgage
$305,000
Outstanding Balance
$276,406
Interest Rate
3.1%
Mortgage Type
Purchase Money Mortgage
Estimated Equity
$262,117
Purchase Details
Closed on
Nov 17, 2020
Sold by
Beland Roselie
Bought by
Smc Llc
Purchase Details
Closed on
Sep 1, 2011
Sold by
Department Of Housing & Urban Dev
Bought by
Beland Roselie
Purchase Details
Closed on
Jan 6, 2011
Sold by
Nolin Gary W
Bought by
Citimortgage Inc
Purchase Details
Closed on
Mar 21, 2000
Sold by
Costa Cynthia M and Barao Raymond F
Bought by
Nolin Gary W and Nolin Cathy J
Purchase Details
Closed on
May 30, 1997
Sold by
Lachapelle Nancy
Bought by
Dacosta Derek A and Dacosta Cynthia M
Purchase Details
Closed on
Dec 29, 1994
Sold by
Potkay Mitchell and Potkay Lillian
Bought by
Lachapelle Nancy
Create a Home Valuation Report for This Property
The Home Valuation Report is an in-depth analysis detailing your home's value as well as a comparison with similar homes in the area
Home Values in the Area
Average Home Value in this Area
Purchase History
| Date | Buyer | Sale Price | Title Company |
|---|---|---|---|
| Santos Susan J | $355,000 | None Available | |
| Smc Llc | $220,000 | None Available | |
| Beland Roselie | $170,000 | -- | |
| Citimortgage Inc | $330,372 | -- | |
| Nolin Gary W | $113,000 | -- | |
| Dacosta Derek A | $93,500 | -- | |
| Lachapelle Nancy | $72,000 | -- |
Source: Public Records
Mortgage History
| Date | Status | Borrower | Loan Amount |
|---|---|---|---|
| Open | Santos Susan J | $305,000 | |
| Previous Owner | Lachapelle Nancy | $291,654 | |
| Previous Owner | Lachapelle Nancy | $288,767 |
Source: Public Records
Tax History
| Year | Tax Paid | Tax Assessment Tax Assessment Total Assessment is a certain percentage of the fair market value that is determined by local assessors to be the total taxable value of land and additions on the property. | Land | Improvement |
|---|---|---|---|---|
| 2025 | $40 | $433,600 | $170,700 | $262,900 |
| 2024 | $3,884 | $420,800 | $170,700 | $250,100 |
| 2023 | $3,787 | $380,600 | $149,500 | $231,100 |
| 2022 | $3,688 | $360,900 | $138,900 | $222,000 |
| 2021 | $3,487 | $308,900 | $125,700 | $183,200 |
| 2020 | $3,382 | $305,800 | $125,700 | $180,100 |
| 2019 | $3,153 | $270,200 | $104,300 | $165,900 |
| 2018 | $4,456 | $254,700 | $99,200 | $155,500 |
| 2017 | $2,929 | $243,300 | $99,200 | $144,100 |
| 2016 | $2,812 | $230,900 | $99,200 | $131,700 |
| 2015 | $2,765 | $227,600 | $99,200 | $128,400 |
Source: Public Records
Map
Nearby Homes
Your Personal Tour Guide
Ask me questions while you tour the home.