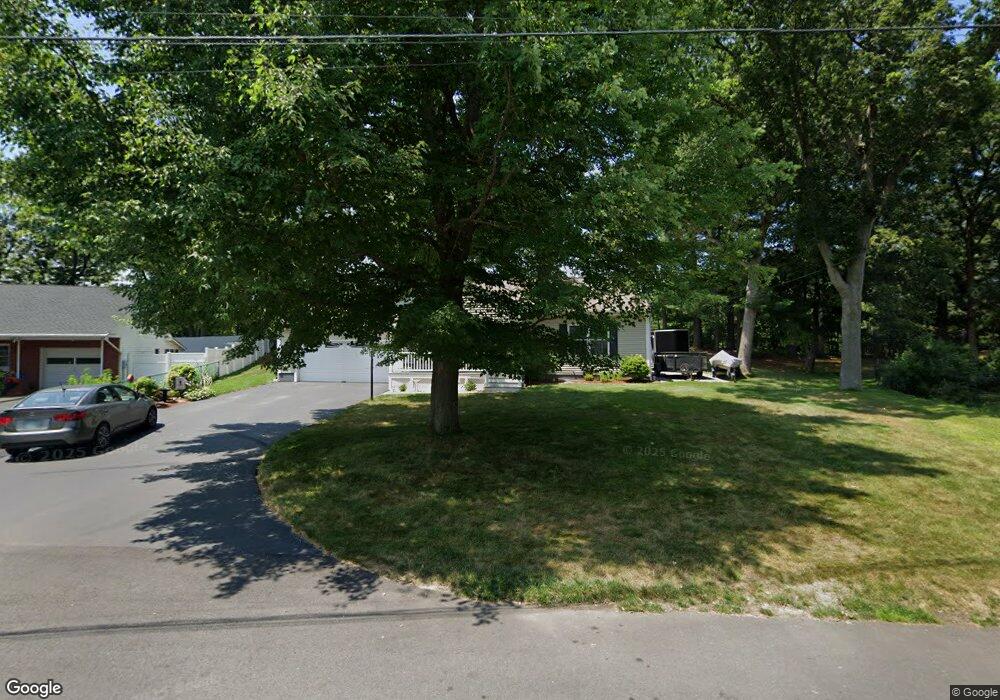
8 Dawn St Nashua, NH 03064
North End Nashua NeighborhoodEstimated Value: $456,000 - $503,000
2
Beds
2
Baths
1,352
Sq Ft
$353/Sq Ft
Est. Value
About This Home
This home is located at 8 Dawn St, Nashua, NH 03064 and is currently estimated at $476,888, approximately $352 per square foot. 8 Dawn St is a home located in Hillsborough County with nearby schools including Charlotte Ave Elementary School, Pennichuck Middle School, and Nashua High School North.
Ownership History
Date
Name
Owned For
Owner Type
Purchase Details
Closed on
Oct 3, 2023
Sold by
Gadbois Gregory A and Gadbois Normand L
Bought by
Gadbois
Current Estimated Value
Purchase Details
Closed on
Aug 31, 2004
Sold by
Lemay Excavation Inc
Bought by
Wilmot Daniel R and Wilmot Donna L
Home Financials for this Owner
Home Financials are based on the most recent Mortgage that was taken out on this home.
Original Mortgage
$131,462
Interest Rate
6.02%
Mortgage Type
Purchase Money Mortgage
Create a Home Valuation Report for This Property
The Home Valuation Report is an in-depth analysis detailing your home's value as well as a comparison with similar homes in the area
Home Values in the Area
Average Home Value in this Area
Purchase History
| Date | Buyer | Sale Price | Title Company |
|---|---|---|---|
| Gadbois | -- | None Available | |
| Wilmot Daniel R | $161,900 | -- |
Source: Public Records
Mortgage History
| Date | Status | Borrower | Loan Amount |
|---|---|---|---|
| Previous Owner | Wilmot Daniel R | $148,000 | |
| Previous Owner | Wilmot Daniel R | $20,000 | |
| Previous Owner | Wilmot Daniel R | $131,462 |
Source: Public Records
Tax History Compared to Growth
Tax History
| Year | Tax Paid | Tax Assessment Tax Assessment Total Assessment is a certain percentage of the fair market value that is determined by local assessors to be the total taxable value of land and additions on the property. | Land | Improvement |
|---|---|---|---|---|
| 2024 | $6,017 | $378,400 | $80,600 | $297,800 |
| 2023 | $6,176 | $338,800 | $80,600 | $258,200 |
| 2022 | $6,122 | $338,800 | $80,600 | $258,200 |
| 2021 | $6,151 | $264,900 | $80,600 | $184,300 |
| 2020 | $5,908 | $261,300 | $80,600 | $180,700 |
| 2019 | $5,686 | $261,300 | $80,600 | $180,700 |
| 2018 | $5,542 | $261,300 | $80,600 | $180,700 |
| 2017 | $5,560 | $215,600 | $85,300 | $130,300 |
| 2016 | $5,405 | $215,600 | $85,300 | $130,300 |
| 2015 | $5,289 | $215,600 | $85,300 | $130,300 |
| 2014 | $5,185 | $215,600 | $85,300 | $130,300 |
Source: Public Records
Map
Nearby Homes
- 3 Wright Rd
- 44 Broad St
- 19 Dunloggin Rd
- 7 Robert Dr
- 11 Amherst Terrace
- 31 Ashland St
- 239 Broad St
- 30 Burgess St
- 74 Profile Cir
- 33 Ferry Rd
- 0 Baldwin St
- 7 Bitirnas St Unit U7
- 123 Cannongate III
- 17 Danbury Rd
- 74 Cannongate III Unit 3
- 4 Reservoir St
- 5 Chatfield Dr Unit U18
- 16 Juliana Ave
- 4 Jared Cir Unit U21
- 31 Juliana Ave