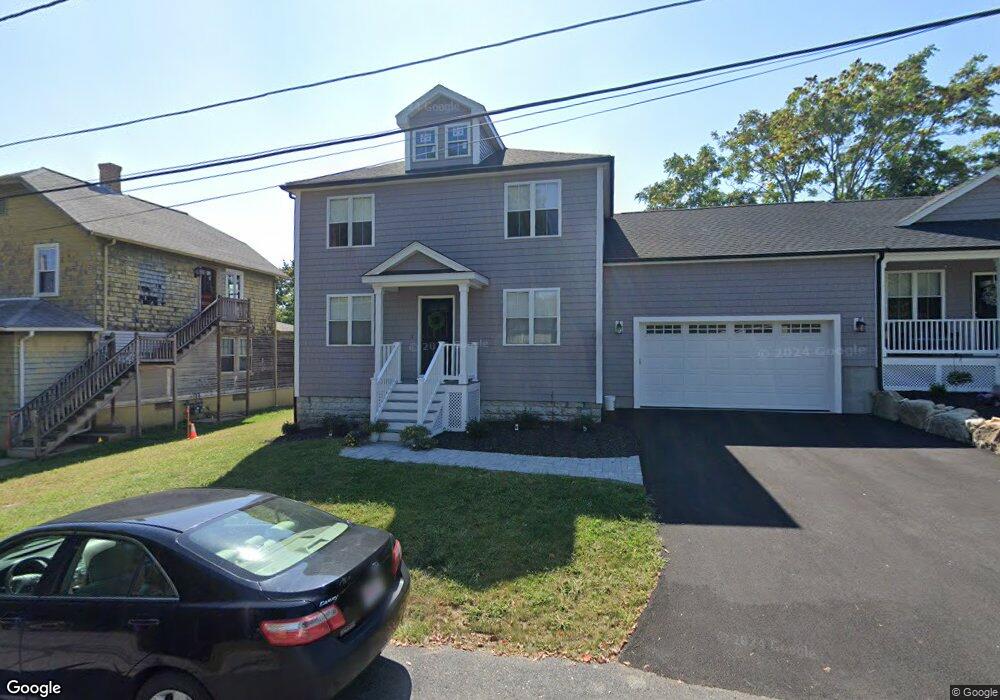
8 Della St Milford, MA 01757
Estimated Value: $613,000 - $720,354
6
Beds
3
Baths
2,480
Sq Ft
$266/Sq Ft
Est. Value
About This Home
This home is located at 8 Della St, Milford, MA 01757 and is currently estimated at $659,589, approximately $265 per square foot. 8 Della St is a home located in Worcester County with nearby schools including Milford High School and Bethany Christian Academy.
Ownership History
Date
Name
Owned For
Owner Type
Purchase Details
Closed on
May 2, 2022
Sold by
Bertulli Mary A and Cafarelli Deborah A
Bought by
Bertulli Mary A and Cafarelli Deborah A
Current Estimated Value
Purchase Details
Closed on
Feb 23, 2009
Sold by
Cafarelli Deborah A and Bertulli Mary Ann
Bought by
Cafarelli Deborah A and Ferrelli Doris
Purchase Details
Closed on
Jul 23, 2004
Sold by
Ferrelli Doris
Bought by
Cafarelli Deborah A and Bertulli Mary Ann
Purchase Details
Closed on
Sep 27, 1968
Bought by
Ferrelli Doris and Bertulli Mary Ann
Create a Home Valuation Report for This Property
The Home Valuation Report is an in-depth analysis detailing your home's value as well as a comparison with similar homes in the area
Home Values in the Area
Average Home Value in this Area
Purchase History
| Date | Buyer | Sale Price | Title Company |
|---|---|---|---|
| Bertulli Mary A | -- | None Available | |
| Cafarelli Deborah A | -- | -- | |
| Cafarelli Deborah A | -- | -- | |
| Ferrelli Doris | -- | -- |
Source: Public Records
Tax History
| Year | Tax Paid | Tax Assessment Tax Assessment Total Assessment is a certain percentage of the fair market value that is determined by local assessors to be the total taxable value of land and additions on the property. | Land | Improvement |
|---|---|---|---|---|
| 2025 | $9,056 | $707,500 | $179,200 | $528,300 |
| 2024 | $8,935 | $672,300 | $172,000 | $500,300 |
| 2023 | $4,141 | $286,600 | $148,700 | $137,900 |
| 2022 | $4,040 | $262,500 | $136,200 | $126,300 |
| 2021 | $3,842 | $240,400 | $136,200 | $104,200 |
| 2020 | $3,792 | $237,600 | $136,200 | $101,400 |
| 2019 | $3,591 | $217,100 | $136,200 | $80,900 |
| 2018 | $3,536 | $213,500 | $132,600 | $80,900 |
| 2017 | $3,410 | $203,100 | $132,600 | $70,500 |
| 2016 | $3,400 | $197,900 | $132,600 | $65,300 |
| 2015 | $3,654 | $208,200 | $125,400 | $82,800 |
Source: Public Records
Map
Nearby Homes
Your Personal Tour Guide
Ask me questions while you tour the home.