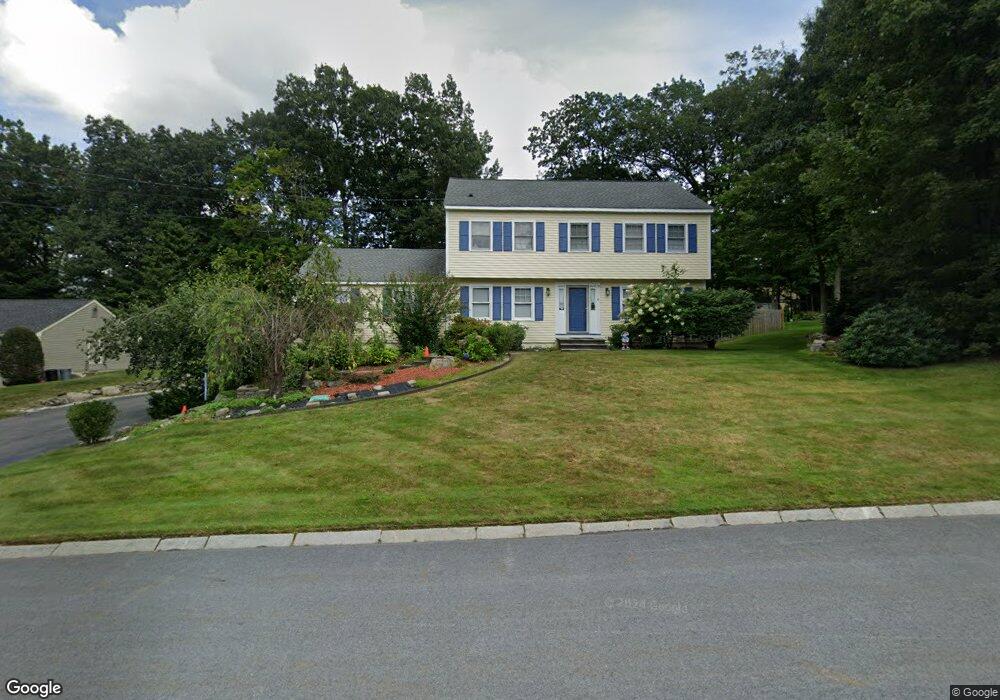
8 Dustin Dr Nashua, NH 03062
Southwest Nashua NeighborhoodEstimated Value: $724,074 - $809,000
4
Beds
3
Baths
2,393
Sq Ft
$323/Sq Ft
Est. Value
About This Home
This home is located at 8 Dustin Dr, Nashua, NH 03062 and is currently estimated at $772,019, approximately $322 per square foot. 8 Dustin Dr is a home located in Hillsborough County with nearby schools including Bicentennial Elementary School, Fairgrounds Middle School, and Nashua High School South.
Ownership History
Date
Name
Owned For
Owner Type
Purchase Details
Closed on
Oct 25, 2011
Sold by
Scribner-Maclean Andrew N and Scribner-Maclean Michelle
Bought by
Luo Tsai I and Luo Yen Fu
Current Estimated Value
Purchase Details
Closed on
Jan 24, 2003
Sold by
Poirier Michael R and Poirier Henrietta L
Bought by
Scribner-Maclean Andrew N and Scribner-Maclean Michelle
Home Financials for this Owner
Home Financials are based on the most recent Mortgage that was taken out on this home.
Original Mortgage
$305,910
Interest Rate
6.11%
Mortgage Type
Purchase Money Mortgage
Purchase Details
Closed on
Oct 30, 1997
Sold by
Pollack Jody P and Pollack Arlene L
Bought by
Poirier Michael R and Poirier Henrietta L
Home Financials for this Owner
Home Financials are based on the most recent Mortgage that was taken out on this home.
Original Mortgage
$177,600
Interest Rate
7.31%
Mortgage Type
Purchase Money Mortgage
Create a Home Valuation Report for This Property
The Home Valuation Report is an in-depth analysis detailing your home's value as well as a comparison with similar homes in the area
Home Values in the Area
Average Home Value in this Area
Purchase History
| Date | Buyer | Sale Price | Title Company |
|---|---|---|---|
| Luo Tsai I | $300,000 | -- | |
| Scribner-Maclean Andrew N | $339,900 | -- | |
| Poirier Michael R | $222,000 | -- |
Source: Public Records
Mortgage History
| Date | Status | Borrower | Loan Amount |
|---|---|---|---|
| Previous Owner | Poirier Michael R | $392,000 | |
| Previous Owner | Poirier Michael R | $395,200 | |
| Previous Owner | Poirier Michael R | $305,910 | |
| Previous Owner | Poirier Michael R | $177,600 |
Source: Public Records
Tax History Compared to Growth
Tax History
| Year | Tax Paid | Tax Assessment Tax Assessment Total Assessment is a certain percentage of the fair market value that is determined by local assessors to be the total taxable value of land and additions on the property. | Land | Improvement |
|---|---|---|---|---|
| 2024 | $10,500 | $660,400 | $180,900 | $479,500 |
| 2023 | $9,992 | $548,100 | $144,700 | $403,400 |
| 2022 | $9,904 | $548,100 | $144,700 | $403,400 |
| 2021 | $9,246 | $398,200 | $106,100 | $292,100 |
| 2020 | $9,030 | $399,400 | $106,100 | $293,300 |
| 2019 | $8,691 | $399,400 | $106,100 | $293,300 |
| 2018 | $8,471 | $399,400 | $106,100 | $293,300 |
| 2017 | $8,846 | $343,000 | $91,700 | $251,300 |
| 2016 | $8,599 | $343,000 | $91,700 | $251,300 |
| 2015 | $8,414 | $343,000 | $91,700 | $251,300 |
| 2014 | $8,249 | $343,000 | $91,700 | $251,300 |
Source: Public Records
Map
Nearby Homes
- 9 Byron Dr
- 61 Spindlewick Dr
- 125 Lille Rd
- 59 Pike St
- 17 Herrick St
- 29 Dickens St
- 15 Learned St Unit 123
- 36 Eastman St Unit 26
- 5 Appaloosa Place
- 6 Hayden St
- 7 Fairhaven Rd
- 160 Daniel Webster Hwy Unit 328
- 57 Wethersfield Rd
- 73 Bluestone Dr
- 85 Bluestone Dr
- 92 Bluestone Dr
- 33 Cannon Dr
- 29 Greenwood Dr
- 130 E Hobart St Unit 85
- 5 Louisburg Square Unit 11