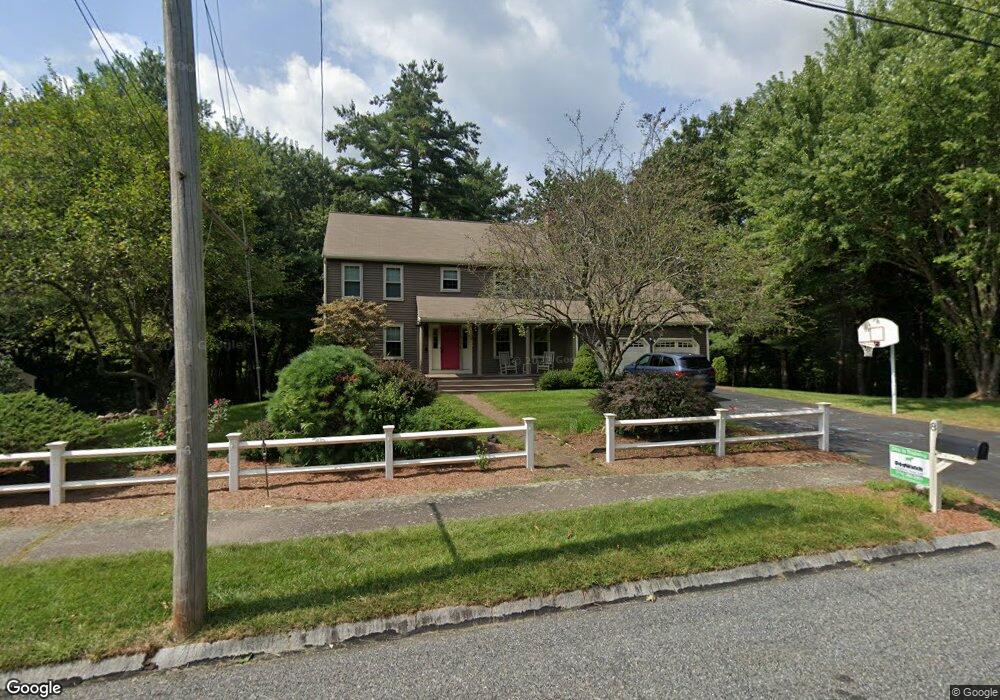
8 Emilio Dr Franklin, MA 02038
Wadsworth NeighborhoodEstimated Value: $811,000 - $924,000
4
Beds
3
Baths
2,071
Sq Ft
$416/Sq Ft
Est. Value
About This Home
This home is located at 8 Emilio Dr, Franklin, MA 02038 and is currently estimated at $862,500, approximately $416 per square foot. 8 Emilio Dr is a home located in Norfolk County with nearby schools including Jefferson Elementary School, Remington Middle School, and Franklin High School.
Ownership History
Date
Name
Owned For
Owner Type
Purchase Details
Closed on
Aug 13, 2001
Sold by
Menke John C and Menke Susan B
Bought by
Connelly Matthew R and Connelly Christina A
Current Estimated Value
Home Financials for this Owner
Home Financials are based on the most recent Mortgage that was taken out on this home.
Original Mortgage
$250,000
Interest Rate
7.1%
Mortgage Type
Purchase Money Mortgage
Purchase Details
Closed on
May 3, 1993
Sold by
Walder William R and Walder Carol A
Bought by
Menke John C and Menke Susan B
Home Financials for this Owner
Home Financials are based on the most recent Mortgage that was taken out on this home.
Original Mortgage
$128,500
Interest Rate
7.51%
Mortgage Type
Purchase Money Mortgage
Purchase Details
Closed on
Dec 22, 1989
Sold by
Morgan Ward
Bought by
Walder William H
Home Financials for this Owner
Home Financials are based on the most recent Mortgage that was taken out on this home.
Original Mortgage
$150,000
Interest Rate
9.69%
Mortgage Type
Purchase Money Mortgage
Create a Home Valuation Report for This Property
The Home Valuation Report is an in-depth analysis detailing your home's value as well as a comparison with similar homes in the area
Home Values in the Area
Average Home Value in this Area
Purchase History
| Date | Buyer | Sale Price | Title Company |
|---|---|---|---|
| Connelly Matthew R | $357,000 | -- | |
| Menke John C | $200,500 | -- | |
| Walder William H | $202,000 | -- |
Source: Public Records
Mortgage History
| Date | Status | Borrower | Loan Amount |
|---|---|---|---|
| Open | Walder William H | $225,500 | |
| Closed | Connelly Matthew R | $250,000 | |
| Previous Owner | Walder William H | $128,500 | |
| Previous Owner | Walder William H | $20,000 | |
| Previous Owner | Walder William H | $150,000 |
Source: Public Records
Tax History
| Year | Tax Paid | Tax Assessment Tax Assessment Total Assessment is a certain percentage of the fair market value that is determined by local assessors to be the total taxable value of land and additions on the property. | Land | Improvement |
|---|---|---|---|---|
| 2025 | $8,824 | $759,400 | $358,300 | $401,100 |
| 2024 | $9,033 | $766,200 | $358,300 | $407,900 |
| 2023 | $8,569 | $681,200 | $342,300 | $338,900 |
| 2022 | $7,942 | $565,300 | $265,400 | $299,900 |
| 2021 | $7,281 | $497,000 | $256,200 | $240,800 |
| 2020 | $7,082 | $488,100 | $258,700 | $229,400 |
| 2019 | $6,851 | $467,300 | $238,000 | $229,300 |
| 2018 | $6,702 | $457,500 | $251,000 | $206,500 |
| 2017 | $6,783 | $465,200 | $258,700 | $206,500 |
| 2016 | $6,334 | $436,800 | $238,300 | $198,500 |
| 2015 | $6,144 | $414,000 | $215,500 | $198,500 |
| 2014 | $6,199 | $429,000 | $207,200 | $221,800 |
Source: Public Records
Map
Nearby Homes
- 1 Washington St
- 3 Washington St
- 374-378 Union St
- 0 Fall Ln
- 1 Spring St
- 139 King St Unit 306
- 99 Summer St
- 82 Uncas Ave
- 82 Uncas Ave Unit 1
- 80 Uncas Ave
- 76 Uncas Ave
- 66 Uncas Ave
- 68 Uncas Ave
- 90 E Central St Unit 103
- 90 E Central St Unit 106
- 90 E Central St Unit 304
- 90 E Central St Unit 202
- 90 E Central St Unit 105
- 90 E Central St Unit 301
- 64 Uncas Ave
Your Personal Tour Guide
Ask me questions while you tour the home.