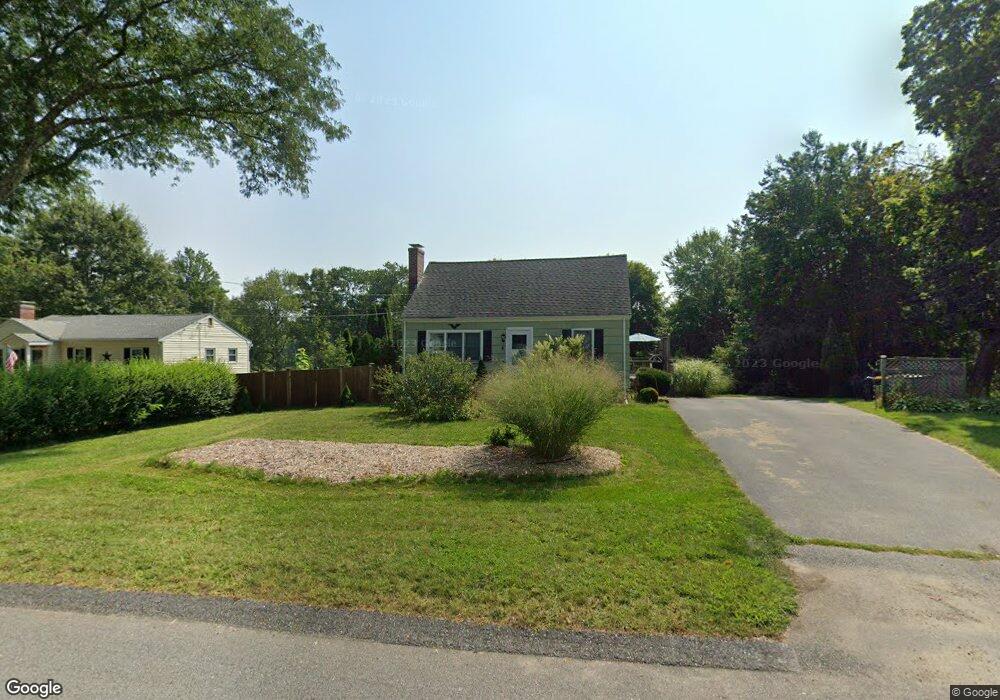
8 Fannie Way Franklin, MA 02038
Estimated Value: $582,052 - $596,000
3
Beds
3
Baths
1,344
Sq Ft
$440/Sq Ft
Est. Value
About This Home
This home is located at 8 Fannie Way, Franklin, MA 02038 and is currently estimated at $590,763, approximately $439 per square foot. 8 Fannie Way is a home located in Norfolk County with nearby schools including John F. Kennedy Memorial School, Horace Mann Middle School, and Franklin High School.
Ownership History
Date
Name
Owned For
Owner Type
Purchase Details
Closed on
Nov 8, 2023
Sold by
Ballantyne Janice M and Ballantyne Peter G
Bought by
Ballantyne Ft and Ballantyne
Current Estimated Value
Purchase Details
Closed on
Jul 2, 1976
Bought by
Ballantyne Peter G and Ballantyne Janice M
Create a Home Valuation Report for This Property
The Home Valuation Report is an in-depth analysis detailing your home's value as well as a comparison with similar homes in the area
Home Values in the Area
Average Home Value in this Area
Purchase History
| Date | Buyer | Sale Price | Title Company |
|---|---|---|---|
| Ballantyne Ft | -- | None Available | |
| Ballantyne Peter G | -- | -- |
Source: Public Records
Tax History Compared to Growth
Tax History
| Year | Tax Paid | Tax Assessment Tax Assessment Total Assessment is a certain percentage of the fair market value that is determined by local assessors to be the total taxable value of land and additions on the property. | Land | Improvement |
|---|---|---|---|---|
| 2025 | $6,092 | $524,300 | $243,400 | $280,900 |
| 2024 | $5,455 | $462,700 | $243,400 | $219,300 |
| 2023 | $5,484 | $435,900 | $245,400 | $190,500 |
| 2022 | $5,214 | $371,100 | $202,800 | $168,300 |
| 2021 | $5,082 | $346,900 | $217,300 | $129,600 |
| 2020 | $4,968 | $342,400 | $219,100 | $123,300 |
| 2019 | $4,719 | $321,900 | $198,500 | $123,400 |
| 2018 | $4,616 | $315,100 | $204,200 | $110,900 |
| 2017 | $4,348 | $298,200 | $187,300 | $110,900 |
| 2016 | $4,067 | $280,500 | $184,200 | $96,300 |
| 2015 | $4,096 | $276,000 | $179,700 | $96,300 |
| 2014 | $3,573 | $247,300 | $151,000 | $96,300 |
Source: Public Records
Map
Nearby Homes
- 951 Pond St
- 14 Hawthorne Village Unit D
- 18 Mary Anne Dr
- 17 Pine St
- 455 Hartford Ave
- 21 Riverside Rd
- 462 Hartford Ave
- 387 Hartford Ave
- 60 Southgate Rd
- 0 Old Log Lane (Farm St) Unit 73416329
- 220 Main St Unit 220
- 2 Noanet Brook Ln
- 0 Elm St
- 5 Fales St
- 4 Shaw St
- 39 West St
- 28 Wellington St
- 280 Village St Unit D2
- 6 Freedom Trail
- 7 Gloucester Dr