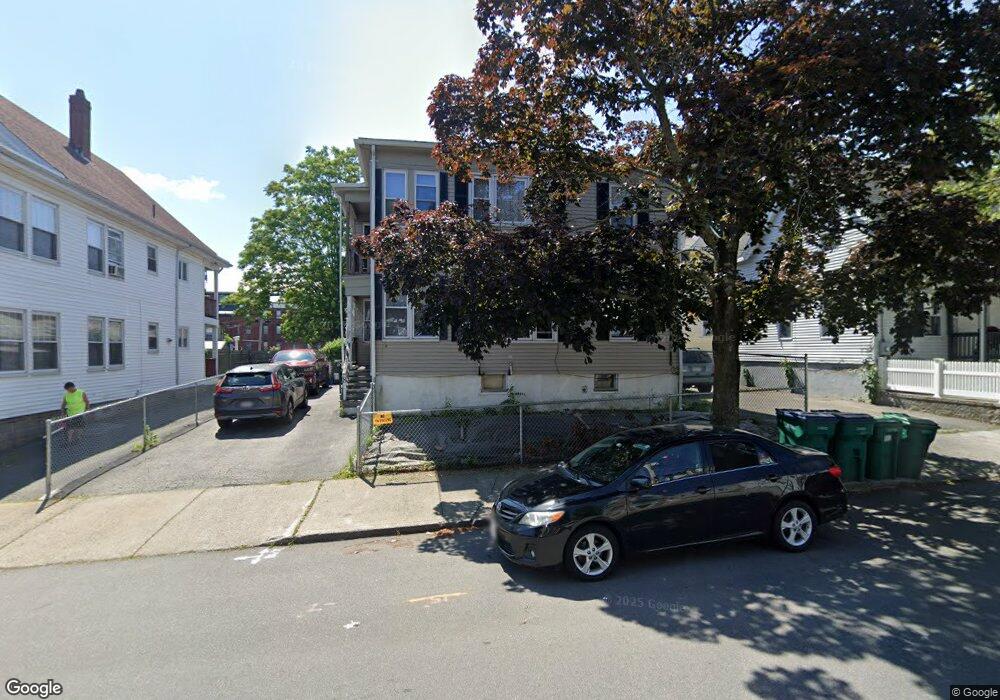
8 Flint St Lynn, MA 01905
Lower Boston Street NeighborhoodEstimated Value: $643,763 - $693,000
4
Beds
2
Baths
1,952
Sq Ft
$345/Sq Ft
Est. Value
About This Home
This home is located at 8 Flint St, Lynn, MA 01905 and is currently estimated at $674,191, approximately $345 per square foot. 8 Flint St is a home located in Essex County with nearby schools including William R. Fallon School, Lincoln-Thomson Elementary School, and Breed Middle School.
Ownership History
Date
Name
Owned For
Owner Type
Purchase Details
Closed on
Aug 21, 2003
Sold by
Urbanski Edward F and Urbanski June M
Bought by
Quinones Ramon
Current Estimated Value
Home Financials for this Owner
Home Financials are based on the most recent Mortgage that was taken out on this home.
Original Mortgage
$295,365
Outstanding Balance
$129,119
Interest Rate
5.52%
Mortgage Type
Purchase Money Mortgage
Estimated Equity
$545,072
Create a Home Valuation Report for This Property
The Home Valuation Report is an in-depth analysis detailing your home's value as well as a comparison with similar homes in the area
Home Values in the Area
Average Home Value in this Area
Purchase History
| Date | Buyer | Sale Price | Title Company |
|---|---|---|---|
| Quinones Ramon | $300,000 | -- |
Source: Public Records
Mortgage History
| Date | Status | Borrower | Loan Amount |
|---|---|---|---|
| Open | Quinones Ramon | $16,225 | |
| Open | Quinones Ramon | $295,365 |
Source: Public Records
Tax History
| Year | Tax Paid | Tax Assessment Tax Assessment Total Assessment is a certain percentage of the fair market value that is determined by local assessors to be the total taxable value of land and additions on the property. | Land | Improvement |
|---|---|---|---|---|
| 2025 | $6,760 | $652,487 | $214,800 | $437,687 |
| 2024 | $6,252 | $593,700 | $188,700 | $405,000 |
| 2023 | $6,372 | $571,500 | $194,900 | $376,600 |
| 2022 | $6,132 | $493,300 | $144,300 | $349,000 |
| 2021 | $5,780 | $443,600 | $132,700 | $310,900 |
| 2020 | $5,416 | $404,200 | $127,700 | $276,500 |
| 2019 | $5,268 | $368,400 | $120,300 | $248,100 |
| 2018 | $5,178 | $341,800 | $132,700 | $209,100 |
| 2017 | $4,786 | $306,800 | $110,300 | $196,500 |
| 2016 | $4,480 | $276,900 | $103,300 | $173,600 |
| 2015 | $4,296 | $256,500 | $102,400 | $154,100 |
Source: Public Records
Map
Nearby Homes
- 73 Waterhill St
- 28 Wyman St
- 78-80 Spencer St
- 46 Wilfred St
- 590 Boston St Unit 303
- 20 Murray St
- 70 Wyman St
- 50-50A Kirtland St
- 45 Cottage St Unit 3
- 79 Laurel St
- 6 Morris St
- 34 Grove St
- 268 Walnut St
- 16 Salem St
- 11 Margin St Unit 7
- 24 Hathaway St
- 117 South St
- 274 Boston St
- 66 Harwood St
- 99 New Park St
Your Personal Tour Guide
Ask me questions while you tour the home.