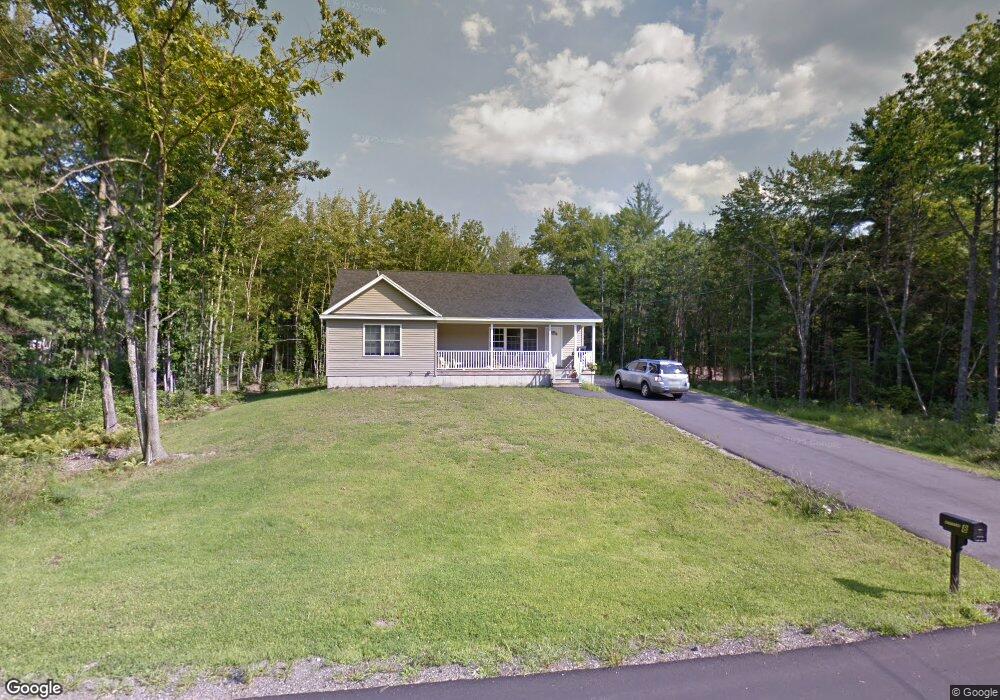
8 Foss Rd Saco, ME 04072
North Saco NeighborhoodEstimated Value: $489,673 - $522,000
3
Beds
2
Baths
1,334
Sq Ft
$378/Sq Ft
Est. Value
About This Home
This home is located at 8 Foss Rd, Saco, ME 04072 and is currently estimated at $503,668, approximately $377 per square foot. 8 Foss Rd is a home located in York County with nearby schools including C K Burns School, Saco Middle School, and Saint James School.
Ownership History
Date
Name
Owned For
Owner Type
Purchase Details
Closed on
May 17, 2013
Sold by
Norcross Ethan D
Bought by
Glenn Cyndi M and Glenn 3Rd Francis J
Current Estimated Value
Home Financials for this Owner
Home Financials are based on the most recent Mortgage that was taken out on this home.
Original Mortgage
$206,632
Outstanding Balance
$147,011
Interest Rate
3.57%
Mortgage Type
New Conventional
Estimated Equity
$356,657
Purchase Details
Closed on
Dec 1, 2009
Sold by
Zenner Ronald R
Bought by
Norcross Ethan D and Norcross Lisa Y
Home Financials for this Owner
Home Financials are based on the most recent Mortgage that was taken out on this home.
Original Mortgage
$194,085
Interest Rate
4.92%
Mortgage Type
FHA
Create a Home Valuation Report for This Property
The Home Valuation Report is an in-depth analysis detailing your home's value as well as a comparison with similar homes in the area
Home Values in the Area
Average Home Value in this Area
Purchase History
| Date | Buyer | Sale Price | Title Company |
|---|---|---|---|
| Glenn Cyndi M | -- | -- | |
| Norcross Ethan D | -- | -- |
Source: Public Records
Mortgage History
| Date | Status | Borrower | Loan Amount |
|---|---|---|---|
| Open | Glenn Cyndi M | $206,632 | |
| Previous Owner | Norcross Ethan D | $194,085 |
Source: Public Records
Tax History
| Year | Tax Paid | Tax Assessment Tax Assessment Total Assessment is a certain percentage of the fair market value that is determined by local assessors to be the total taxable value of land and additions on the property. | Land | Improvement |
|---|---|---|---|---|
| 2024 | $5,422 | $385,912 | $146,012 | $239,900 |
| 2023 | $5,692 | $385,912 | $146,012 | $239,900 |
| 2022 | $5,169 | $282,000 | $111,200 | $170,800 |
| 2021 | $4,971 | $263,300 | $99,400 | $163,900 |
| 2020 | $4,707 | $239,300 | $87,500 | $151,800 |
| 2019 | $4,638 | $239,300 | $87,500 | $151,800 |
| 2018 | $4,291 | $221,400 | $79,500 | $141,900 |
| 2017 | $4,122 | $212,700 | $72,500 | $140,200 |
| 2016 | $3,756 | $193,400 | $55,600 | $137,800 |
| 2015 | $3,684 | $191,700 | $55,600 | $136,100 |
| 2014 | $3,569 | $191,700 | $55,600 | $136,100 |
| 2013 | $3,515 | $189,200 | $55,600 | $133,600 |
Source: Public Records
Map
Nearby Homes
- 4 Primrose Ln
- 18 Buxton Rd
- 5 Coltons Way
- 43 New County Rd
- 4 Spool St Unit 101
- 9 Nottingham Dr
- 51 Sancho Dr
- 18A Garfield St
- 6 Lina Ave
- 7 Hubbard St
- 0 Simpson Rd
- 8 Oakland St
- TBD Oakland St
- 00 Cottonwood Dr
- 5 Brentwood Cir
- 22 Tasker St Unit 11
- 22 Tasker St Unit 10
- 2 Labonte Ave E
- 3 Labonte Ave E
- 224 North St Unit 105
Your Personal Tour Guide
Ask me questions while you tour the home.