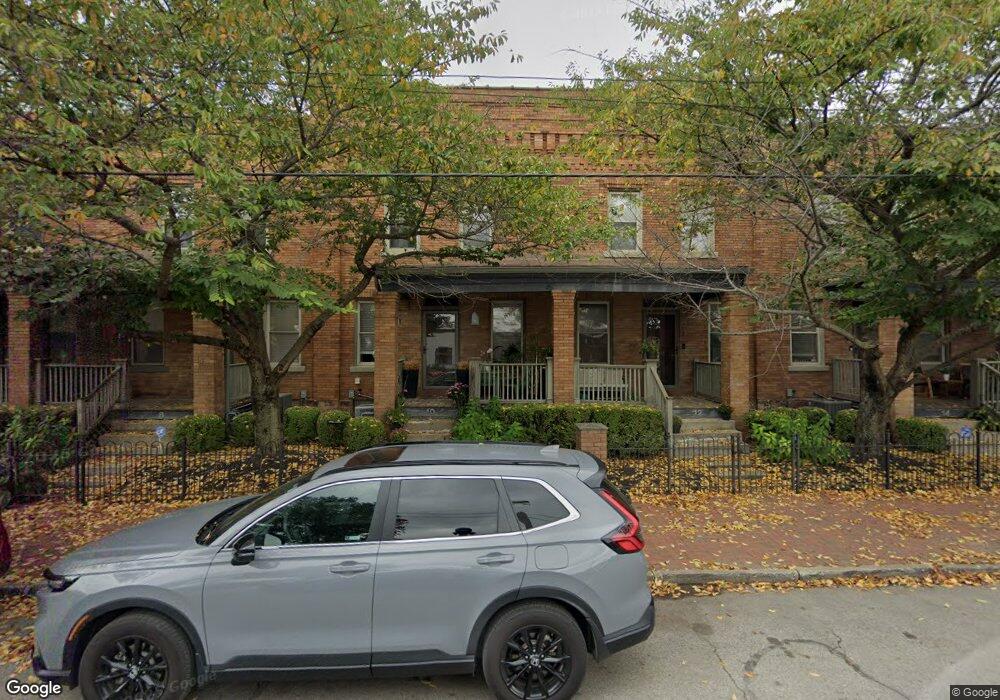
8 Hanford St Unit 8 Columbus, OH 43206
Merion Village NeighborhoodEstimated Value: $254,000 - $279,000
2
Beds
1
Bath
1,124
Sq Ft
$235/Sq Ft
Est. Value
About This Home
This home is located at 8 Hanford St Unit 8, Columbus, OH 43206 and is currently estimated at $264,178, approximately $235 per square foot. 8 Hanford St Unit 8 is a home located in Franklin County with nearby schools including Stewart Alternative Elementary School @ Beck Elementary School, South High School, and Saint Mary School German Village .
Ownership History
Date
Name
Owned For
Owner Type
Purchase Details
Closed on
May 17, 2018
Sold by
Ruff Jeffrey W and Bieber Roy L
Bought by
Mcentyre Glenn A
Current Estimated Value
Home Financials for this Owner
Home Financials are based on the most recent Mortgage that was taken out on this home.
Original Mortgage
$152,280
Outstanding Balance
$131,118
Interest Rate
4.4%
Mortgage Type
Future Advance Clause Open End Mortgage
Estimated Equity
$133,060
Purchase Details
Closed on
Jul 3, 2008
Sold by
Jrb Group Llc
Bought by
Ruff Jeffery W and Bieher Roy L
Purchase Details
Closed on
Mar 18, 2008
Sold by
Ruff Jeffery W and Bieber Roy L
Bought by
Jrb Group Llc
Purchase Details
Closed on
Apr 2, 2002
Sold by
J V B Group Inc
Bought by
Ruff Jeffery W and Bieber Roy L
Create a Home Valuation Report for This Property
The Home Valuation Report is an in-depth analysis detailing your home's value as well as a comparison with similar homes in the area
Home Values in the Area
Average Home Value in this Area
Purchase History
| Date | Buyer | Sale Price | Title Company |
|---|---|---|---|
| Mcentyre Glenn A | $169,200 | Stewart Title Box | |
| Ruff Jeffery W | -- | Attorney | |
| Jrb Group Llc | -- | Attorney | |
| Ruff Jeffery W | $92,500 | Amerititle |
Source: Public Records
Mortgage History
| Date | Status | Borrower | Loan Amount |
|---|---|---|---|
| Open | Mcentyre Glenn A | $152,280 |
Source: Public Records
Tax History Compared to Growth
Tax History
| Year | Tax Paid | Tax Assessment Tax Assessment Total Assessment is a certain percentage of the fair market value that is determined by local assessors to be the total taxable value of land and additions on the property. | Land | Improvement |
|---|---|---|---|---|
| 2024 | $3,483 | $77,600 | $13,650 | $63,950 |
| 2023 | $3,438 | $77,595 | $13,650 | $63,945 |
| 2022 | $2,867 | $55,270 | $22,720 | $32,550 |
| 2021 | $2,872 | $55,270 | $22,720 | $32,550 |
| 2020 | $2,875 | $55,270 | $22,720 | $32,550 |
| 2019 | $3,047 | $50,230 | $20,650 | $29,580 |
| 2018 | $2,874 | $50,230 | $20,650 | $29,580 |
| 2017 | $3,006 | $50,230 | $20,650 | $29,580 |
| 2016 | $2,889 | $42,530 | $18,800 | $23,730 |
| 2015 | $2,631 | $42,530 | $18,800 | $23,730 |
| 2014 | $2,637 | $42,530 | $18,800 | $23,730 |
| 2013 | $1,445 | $47,250 | $20,895 | $26,355 |
Source: Public Records
Map
Nearby Homes
- 6 Hanford St Unit 6
- 1264 S High St
- 17 E Mithoff St
- 65 Frebis Ave
- 1357 City Park Ave Unit 359
- 109 E Mithoff St
- 1272 S 4th St
- 130 E Gates St
- 144 E Mithoff St
- 154-156 E Gates St
- 1366 S 4th St
- 164 Frebis Ave
- 165 Frebis Ave
- 1036 S Front St
- 1437 S High St Unit 439
- 1023 City Park Ave
- 1420 S 4th St
- 195 E Mithoff St Unit 195
- 992-994 S Wall St
- 37 Stewart Ave
- 10 Hanford St Unit 10
- 4 Hanford St Unit 4
- 12 Hanford St Unit 12
- 2 Hanford St Unit 2
- 14 Hanford St Unit 14
- 16 Hanford St Unit 16
- 1226 S High St
- 1224 S High St
- 1224 S High St Unit 1228
- 1228 S High St
- 18 Hanford St Unit 18
- 20 Hanford St Unit 20
- 22 Hanford St
- 22 Hanford St Unit 1224
- 1229 S High St
- 1231 S High St
- 1231 S High St
- 1231 S High St Unit N
- 1231 S High St Unit NORTH
- 1231 S High St Unit NS/SS