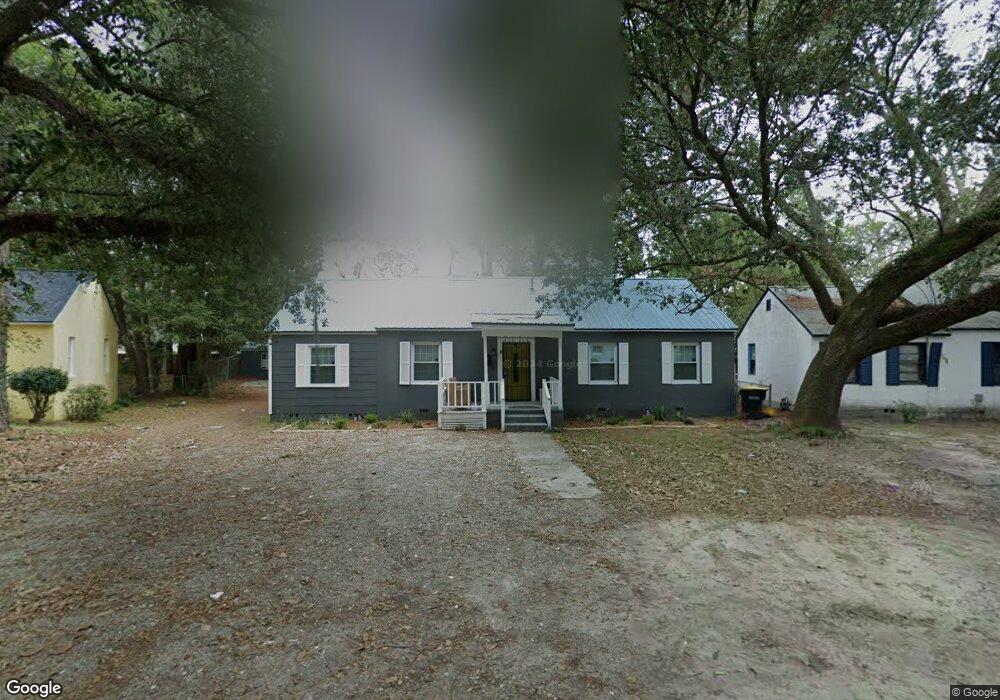
8 Hibiscus Ave Savannah, GA 31404
Live Oak NeighborhoodEstimated Value: $297,000 - $318,000
6
Beds
2
Baths
1,755
Sq Ft
$175/Sq Ft
Est. Value
About This Home
This home is located at 8 Hibiscus Ave, Savannah, GA 31404 and is currently estimated at $306,628, approximately $174 per square foot. 8 Hibiscus Ave is a home located in Chatham County with nearby schools including Spencer Elementary School, Hubert Middle School, and Savannah Arts Academy.
Ownership History
Date
Name
Owned For
Owner Type
Purchase Details
Closed on
Dec 2, 2021
Sold by
Dixon James O
Bought by
Sai Babas Real Estates Inc
Current Estimated Value
Purchase Details
Closed on
Oct 19, 2005
Sold by
Not Provided
Bought by
Dixon James O
Create a Home Valuation Report for This Property
The Home Valuation Report is an in-depth analysis detailing your home's value as well as a comparison with similar homes in the area
Home Values in the Area
Average Home Value in this Area
Purchase History
| Date | Buyer | Sale Price | Title Company |
|---|---|---|---|
| Sai Babas Real Estates Inc | $205,000 | -- | |
| Dixon James O | $85,000 | -- |
Source: Public Records
Tax History Compared to Growth
Tax History
| Year | Tax Paid | Tax Assessment Tax Assessment Total Assessment is a certain percentage of the fair market value that is determined by local assessors to be the total taxable value of land and additions on the property. | Land | Improvement |
|---|---|---|---|---|
| 2025 | $3,814 | $137,920 | $20,000 | $117,920 |
| 2024 | $3,814 | $113,400 | $14,000 | $99,400 |
| 2023 | $1,159 | $95,040 | $14,000 | $81,040 |
| 2022 | $939 | $77,000 | $2,880 | $74,120 |
| 2021 | $2,254 | $48,360 | $2,880 | $45,480 |
| 2020 | $1,196 | $37,880 | $2,880 | $35,000 |
| 2019 | $1,683 | $37,880 | $2,880 | $35,000 |
| 2018 | $1,212 | $26,960 | $2,880 | $24,080 |
| 2017 | $711 | $19,080 | $2,880 | $16,200 |
| 2016 | $473 | $16,200 | $2,880 | $13,320 |
| 2015 | $649 | $15,560 | $2,880 | $12,680 |
Source: Public Records
Map
Nearby Homes
- 9 Oleander Ave
- 0 Williams St Unit SA340410
- 2825 Wicklow St
- 1417 E 42nd St
- 1404 E 40th St
- 1520 E 49th St
- 2033 E 41st St
- 2203 Skidaway Rd
- 1307 E 42nd St
- 2052 E 42nd St
- 1726 E 33rd St
- 1401 NE 36th St
- 1530 E 51st St
- 1501 E 50th St
- 1232 E 42nd St
- 616 Virginia Ave
- 607 Virginia Ave
- 1410 E 51st St
- 1223 E 38th St
- 1228 E 39th St
- 10 Hibiscus Ave
- 6 Hibiscus Ave
- 9 Victory Manor Place
- 7 Victory Manor Place
- 4 Hibiscus Ave
- 5 Victory Manor Place
- 12 Hibiscus Ave
- 7 Hibiscus Ave
- 5 Hibiscus Ave
- 11 Victory Manor Place
- 3 Victory Manor Place
- 13 Victory Manor Place
- 1709 E 41st St
- 3 Hibiscus Ave
- 2 Hibiscus Ave
- 9 Hibiscus Ave
- 1 Victory Manor Place
- 1 Hibiscus Ave
- 11 Hibiscus Ave
- 8 Victory Manor Place